Dried Fruits, mixtures of nuts or dried fruits | Imports and Exports | 2023
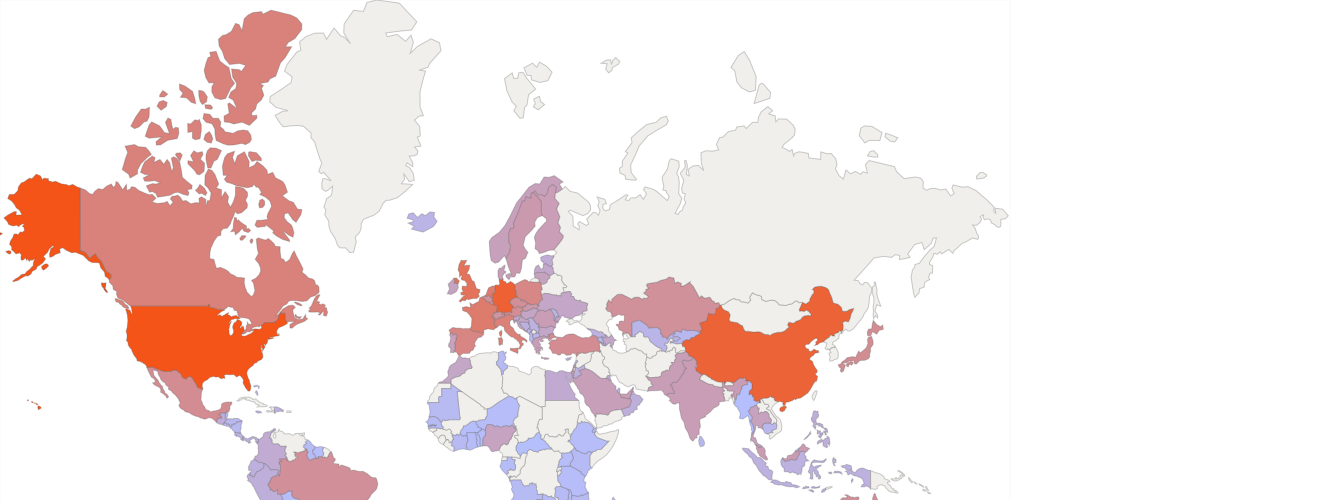
In 2023, the world exports of "Fruit, dried, other than that of headings Nos. 08.01 to 08.06; mixtures of nuts or dried fruits of this Chapter" exceeded $2.9 billion (according to external trade statistics of 121 countries). It was $2.84 billion in the previous year (according to merchandise trade statistics of 127 countries).
There are no trade data (2023) for such exporters as Vietnam (0.756% of the world exports in 2022), Korea (0.191%), Rwanda (0.002%), Nepal (0.001%)
Top exporters of Fruit, dried, other than that of headings Nos. 08.01 to 08.06; mixtures of nuts or dried fruits of this Chapter in 2023
The world's largest exporters of this commodity group in 2023:
- Turkey - 15.8% of the world exports ($460 million)
- Chile - 10.6% ($310 million)
- Thailand - 9.19% ($266 million)
- China - 8.63% ($250 million)
- Germany - 8.2% ($238 million)
«Fruit, dried, other than that of headings Nos. 08.01 to 08.06; mixtures of nuts or dried fruits of this Chapter» accounted for a substantial share of total exports of
- Kyrgyz Republic - 0.544% of Kyrgyz Republic's total exports in 2023 ($18 million of $3.3 billion)
- Moldova - 0.528% ($21 million of $4.04 billion)
- Uzbekistan - 0.414% ($87 million of $21 billion)
- Chile - 0.326% ($310 million of $94 billion)
- Serbia - 0.197% ($61 million of $30 billion)
- Turkey - 0.18% ($460 million of $255 billion)
- Myanmar - 0.098% ($14.4 million of $14.7 billion)
- Thailand - 0.093% ($266 million of $285 billion)
According to statistics provided by the major exporters, the largest flows of exports of «Fruit, dried, other than that of headings Nos. 08.01 to 08.06; mixtures of nuts or dried fruits of this Chapter» in 2023:
- Exports from Chile to China: (1.92% of the world exports, $55 million according to external trade statistics of Chile)
- Exports from Chile to USA: (1.47% of the world exports, $42 million according to external trade statistics of Chile)
- Exports from China to USA: (3.74% of the world exports, $108 million according to external trade statistics of China)
- Exports from Spain to Germany: (1.29% of the world exports, $37 million according to external trade statistics of Spain)
- Exports from Spain to Italy: (1.36% of the world exports, $39 million according to external trade statistics of Spain)
- Exports from Thailand to China: (6.38% of the world exports, $185 million according to external trade statistics of Thailand)
- Exports from Turkey to France: (1.37% of the world exports, $39 million according to external trade statistics of Turkey)
- Exports from Turkey to Germany: (2.14% of the world exports, $62 million according to external trade statistics of Turkey)
- Exports from Turkey to USA: (2.64% of the world exports, $76 million according to external trade statistics of Turkey)
- Exports from USA to Canada: (1.71% of the world exports, $49 million according to external trade statistics of USA)
In 2023, the world imports of "Fruit, dried, other than that of headings Nos. 08.01 to 08.06; mixtures of nuts or dried fruits of this Chapter" exceeded $2.66 billion (according to external trade statistics of 141 countries). It was $2.75 billion in the previous year (according to merchandise trade statistics of 140 countries).
Top importers of Fruit, dried, other than that of headings Nos. 08.01 to 08.06; mixtures of nuts or dried fruits of this Chapter in 2023
The world's largest importers of this commodity group in 2023:
- USA - 13.5% of the world imports ($359 million)
- Germany - 9.83% ($261 million)
- China - 9.42% ($250 million)
- United Kingdom - 5.86% ($155 million)
- France - 4.35% ($115 million)
- Netherlands - 4.17% ($111 million)
«Fruit, dried, other than that of headings Nos. 08.01 to 08.06; mixtures of nuts or dried fruits of this Chapter» accounted for a substantial share of total imports of
- Kazakhstan - 0.072% of Kazakhstan's total imports in 2023 ($44 million of $61 billion)
- Antigua and Barbuda - 0.063% ($425 thousand of $669 million)
- Azerbaijan - 0.054% ($9.48 million of $17.2 billion)
- Samoa - 0.052% ($249 thousand of $473 million)
- Maldives - 0.044% ($1.53 million of $3.48 billion)
According to statistics provided by the major importers, the largest flows of imports of «Fruit, dried, other than that of headings Nos. 08.01 to 08.06; mixtures of nuts or dried fruits of this Chapter» in 2023:
- Imports to China from Chile (2.2% of the world imports, $58 million according to external trade statistics of China)
- Imports to China from Thailand (5.36% of the world imports, $142 million according to external trade statistics of China)
- Imports to France from Germany (1.27% of the world imports, $33 million according to external trade statistics of France)
- Imports to France from Turkey (1.63% of the world imports, $43 million according to external trade statistics of France)
- Imports to Germany from Turkey (2.64% of the world imports, $70 million according to external trade statistics of Germany)
- Imports to United Kingdom from Turkey (1.69% of the world imports, $45 million according to external trade statistics of United Kingdom)
- Imports to USA from Chile (2.17% of the world imports, $57 million according to external trade statistics of USA)
- Imports to USA from China (1.67% of the world imports, $44 million according to external trade statistics of USA)
- Imports to USA from Egypt (2.66% of the world imports, $70 million according to external trade statistics of USA)
- Imports to USA from Turkey (3.21% of the world imports, $85 million according to external trade statistics of USA)
| Reporter | 0813. Fruit, dried, other than that of headings Nos. 08.01 to 08.06; mixtures of nuts or dried fruits of this Chapter | |||
| Exports | Imports | |||
| 2023 | 2023 | |||
| Value (US$) | World Share ($), % | Value (US$) | World Share ($), % | |
| Turkey | 460,189,989.00 | 15.86 | 55,510,749.00 | 2.08 |
| Chile | 310,155,583.44 | 10.68 | 6,247,399.60 | 0.23 |
| Thailand | 266,763,278.61 | 9.19 | 14,680,274.98 | 0.55 |
| China | 250,534,808.00 | 8.63 | 250,812,009.00 | 9.42 |
| Germany | 238,166,936.59 | 8.20 | 261,592,734.78 | 9.83 |
| USA | 213,665,119.00 | 7.36 | 359,760,429.00 | 13.52 |
| Spain | 198,793,816.33 | 6.85 | 75,251,869.98 | 2.82 |
| Netherlands | 100,387,553.18 | 3.45 | 111,191,625.99 | 4.17 |
| France | 97,165,664.63 | 3.34 | 115,864,420.24 | 4.35 |
| Uzbekistan | 87,173,633.01 | 3.00 | 1,065,661.98 | 0.04 |
| Poland | 65,011,989.00 | 2.24 | 71,490,500.00 | 2.68 |
| Serbia | 61,141,892.00 | 2.10 | 2,642,557.00 | 0.09 |
| South Africa | 50,859,234.92 | 1.75 | 3,581,535.63 | 0.13 |
| Italy | 44,307,967.08 | 1.52 | 93,347,408.87 | 3.50 |
| Austria | 41,194,834.70 | 1.41 | 53,033,294.49 | 1.99 |
| Argentina | 38,698,462.83 | 1.33 | 6,688,351.53 | 0.25 |
| India | 28,446,884.79 | 0.98 | 21,008,950.10 | 0.78 |
| Slovak Republic | 28,135,267.98 | 0.96 | 28,835,126.66 | 1.08 |
| Moldova | 21,401,311.00 | 0.73 | 1,369,340.00 | 0.05 |
| Kyrgyz Republic | 18,025,217.00 | 0.62 | 517,884.00 | 0.01 |
| Lithuania | 17,568,847.00 | 0.60 | 14,475,369.00 | 0.54 |
| Greece | 17,562,893.73 | 0.60 | 19,064,278.46 | 0.71 |
| Denmark | 17,479,009.76 | 0.60 | 18,103,692.00 | 0.68 |
| Mexico | 14,805,440.00 | 0.51 | 57,437,331.00 | 2.15 |
| United Arab Emirates | 14,608,332.94 | 0.50 | 21,428,978.60 | 0.80 |
| Myanmar | 14,475,181.26 | 0.49 | 3,444.70 | 0.00 |
| Philippines | 13,528,256.00 | 0.46 | 3,968,622.00 | 0.14 |
| Czech Republic | 13,185,673.00 | 0.45 | 46,812,996.00 | 1.75 |
| Bulgaria | 12,508,517.30 | 0.43 | 9,724,759.55 | 0.36 |
| Estonia | 11,629,084.04 | 0.40 | 5,071,468.66 | 0.19 |
| United Kingdom | 9,548,100.01 | 0.32 | 155,996,612.53 | 5.86 |
| Indonesia | 9,353,616.85 | 0.32 | 2,675,702.00 | 0.10 |
| Hungary | 8,737,887.00 | 0.30 | 11,154,886.00 | 0.41 |
| Slovenia | 8,704,504.57 | 0.29 | 8,850,176.81 | 0.33 |
| Canada | 8,580,842.88 | 0.29 | 89,856,361.31 | 3.37 |
| Belgium | 7,761,147.83 | 0.26 | 40,190,657.54 | 1.51 |
| Australia | 5,967,338.76 | 0.20 | 47,159,709.65 | 1.77 |
| Ukraine | 5,498,188.21 | 0.18 | 10,025,854.58 | 0.37 |
| Azerbaijan | 4,919,172.26 | 0.16 | 9,485,069.48 | 0.35 |
| Pakistan | 4,701,154.96 | 0.16 | 19,625,223.77 | 0.73 |
| Latvia | 3,955,521.73 | 0.13 | 8,519,686.33 | 0.32 |
| New Zealand | 3,835,804.39 | 0.13 | 14,277,724.29 | 0.53 |
| Hong Kong | 3,673,866.55 | 0.12 | 16,217,430.13 | 0.60 |
| Japan | 3,558,769.17 | 0.12 | 53,791,904.69 | 2.02 |
| Armenia | 3,326,280.19 | 0.11 | 628,913.59 | 0.02 |
| Peru | 2,956,641.57 | 0.10 | 3,718,352.31 | 0.13 |
| Sweden | 2,749,062.70 | 0.09 | 27,645,761.37 | 1.03 |
| Singapore | 2,611,807.79 | 0.09 | 13,490,593.36 | 0.50 |
| Croatia | 2,566,648.00 | 0.08 | 11,719,890.00 | 0.44 |
| Brazil | 2,481,826.00 | 0.08 | 47,368,044.00 | 1.78 |
| Colombia | 2,378,033.95 | 0.08 | 5,876,119.69 | 0.22 |
| Romania | 2,283,540.92 | 0.07 | 21,072,487.71 | 0.79 |
| Portugal | 2,054,839.64 | 0.07 | 16,033,220.85 | 0.60 |
| Georgia | 1,980,795.93 | 0.06 | 2,009,498.52 | 0.07 |
| Saudi Arabia | 1,879,084.48 | 0.06 | 18,405,546.73 | 0.69 |
| Malaysia | 1,723,556.40 | 0.05 | 23,233,941.32 | 0.87 |
| Egypt | 1,498,801.02 | 0.05 | 6,487,026.81 | 0.24 |
| Bosnia and Herzegovina | 1,465,383.35 | 0.05 | 2,545,377.20 | 0.09 |
| Morocco | 1,260,094.01 | 0.04 | 10,382,192.15 | 0.39 |
| Switzerland | 1,078,361.68 | 0.03 | 38,139,633.56 | 1.43 |
| Sri Lanka | 1,044,677.80 | 0.03 | 541,960.96 | 0.02 |
| Burkina Faso | 767,380.01 | 0.02 | 18,708.08 | 0.00 |
| Albania | 623,029.19 | 0.02 | 639,046.52 | 0.02 |
| Luxembourg | 619,009.56 | 0.02 | 2,593,811.12 | 0.09 |
| North Macedonia | 609,456.03 | 0.02 | 1,362,985.18 | 0.05 |
| Finland | 590,263.45 | 0.02 | 20,171,356.96 | 0.75 |
| Ecuador | 579,060.19 | 0.01 | 2,879,599.30 | 0.10 |
| Ghana | 567,187.12 | 0.01 | 78,786.98 | 0.00 |
| Oman | 543,620.28 | 0.01 | 3,750,707.40 | 0.14 |
| Guatemala | 509,572.00 | 0.01 | 3,960,000.00 | 0.14 |
| Kazakhstan | 491,583.69 | 0.01 | 44,551,737.03 | 1.67 |
| Dominican Republic | 482,921.05 | 0.01 | 2,536,045.20 | 0.09 |
| Kuwait | 473,682.87 | 0.01 | 5,543,226.40 | 0.20 |
| Lebanon | 323,438.00 | 0.01 | 1,687,515.00 | 0.06 |
| Ireland | 305,410.80 | 0.01 | 12,445,216.91 | 0.46 |
| Norway | 204,984.66 | 0.00 | 16,878,018.90 | 0.63 |
| Uganda | 203,671.23 | 0.00 | 40,875.62 | 0.00 |
| Montenegro | 198,200.05 | 0.00 | 1,249,040.41 | 0.04 |
| Jordan | 185,431.43 | 0.00 | 2,719,750.03 | 0.10 |
| Mozambique | 156,000.00 | 0.00 | 261,000.00 | 0.00 |
| Guyana | 154,386.67 | 0.00 | 126,948.43 | 0.00 |
| Israel | 129,000.00 | 0.00 | 20,769,372.00 | 0.78 |
| Kenya | 123,409.59 | 0.00 | 137,011.68 | 0.00 |
| Costa Rica | 115,757.31 | 0.00 | 1,959,847.68 | 0.07 |
| Tanzania | 107,270.68 | 0.00 | 64,357.50 | 0.00 |
| Cyprus | 103,027.59 | 0.00 | 3,437,329.15 | 0.12 |
| Madagascar | 81,027.84 | 0.00 | 115,378.13 | 0.00 |
| Fiji | 73,383.03 | 0.00 | 333,651.23 | 0.01 |
| Cambodia | 70,395.44 | 0.00 | 680,361.59 | 0.02 |
| Bolivia | 66,630.73 | 0.00 | 66,049.00 | 0.00 |
| Niger | 66,163.64 | 0.00 | 55,014.85 | 0.00 |
| Nigeria | 54,037.34 | 0.00 | 13,559,191.72 | 0.50 |
| Côte d`Ivoire | 52,650.72 | 0.00 | 224,054.76 | 0.00 |
| Benin | 47,876.40 | 0.00 | 30,912.69 | 0.00 |
| El Salvador | 27,483.00 | 0.00 | 832,637.22 | 0.03 |
| Nicaragua | 26,345.04 | 0.00 | 438,653.89 | 0.01 |
| Bahrain | 22,846.25 | 0.00 | 1,859,721.25 | 0.06 |
| Gambia | 20,103.72 | 0.00 | 10,826.44 | 0.00 |
| Togo | 16,052.49 | 0.00 | 18,560.18 | 0.00 |
| Zimbabwe | 12,300.31 | 0.00 | 216,117.35 | 0.00 |
| Honduras | 10,670.00 | 0.00 | 632,007.80 | 0.02 |
| São Tomé and Principe | 8,723.07 | 0.00 | 14,987.53 | 0.00 |
| Senegal | 7,220.02 | 0.00 | 189,755.66 | 0.00 |
| Angola | 5,236.18 | 0.00 | 177,582.61 | 0.00 |
| Botswana | 4,851.25 | 0.00 | 865,956.25 | 0.03 |
| Suriname | 4,807.43 | 0.00 | 59,160.03 | 0.00 |
| Cabo Verde | 4,281.47 | 0.00 | 233,655.28 | 0.00 |
| China, Macao SAR | 3,673.88 | 0.00 | 1,955,891.25 | 0.07 |
| Jamaica | 3,317.29 | 0.00 | 754,142.62 | 0.02 |
| Lesotho | 2,434.65 | 0.00 | 193,890.91 | 0.00 |
| Iceland | 2,213.47 | 0.00 | 1,283,419.38 | 0.04 |
| Samoa | 1,935.66 | 0.00 | 249,040.12 | 0.00 |
| Gabon | 1,160.16 | 0.00 | 75,740.10 | 0.00 |
| Namibia | 1,056.85 | 0.00 | 1,571,504.19 | 0.05 |
| Mauritius | 944.23 | 0.00 | 1,943,537.67 | 0.07 |
| Saint Vincent and the Grenadines | 929.62 | 0.00 | 59,386.06 | 0.00 |
| Aruba | 314.52 | 0.00 | 437,702.22 | 0.01 |
| Dominica | 60.00 | 0.00 | 99,819.15 | 0.00 |
| Swaziland | 9.35 | 0.00 | 284,567.56 | 0.01 |
| Malawi | 6.69 | 0.00 | 235,187.99 | 0.00 |
| Brunei | 2.97 | 0.00 | 1,525,783.71 | 0.05 |
| Zambia | 133,659.85 | 0.00 | ||
| Uruguay | 729,382.58 | 0.02 | ||
| Tunisia | 222,326.18 | 0.00 | ||
| The Bahamas | 732,479.00 | 0.02 | ||
| Seychelles | 291,972.45 | 0.01 | ||
| Qatar | 2,085,815.67 | 0.07 | ||
| Paraguay | 241,615.81 | 0.00 | ||
| Panama | 2,334,430.00 | 0.08 | ||
| Montserrat | 14,497.54 | 0.00 | ||
| Mauritania | 265,748.58 | 0.00 | ||
| Malta | 1,033,799.84 | 0.03 | ||
| Maldives | 1,535,693.39 | 0.05 | ||
| French Polynesia | 498,999.70 | 0.01 | ||
| Ethiopia | 44,912.29 | 0.00 | ||
| Djibouti | 343,511.26 | 0.01 | ||
| Central African Republic | 5,082.76 | 0.00 | ||
| Belize | 15,682.24 | 0.00 | ||
| Barbados | 714,413.00 | 0.02 | ||
| Antigua and Barbuda | 425,252.36 | 0.01 | ||
| Andorra | 66,497.37 | 0.00 | ||