Granite, merely cut, by sawing/othw., into blocks/slabs of a rect. (incl. square) shape | Imports and Exports | 2023
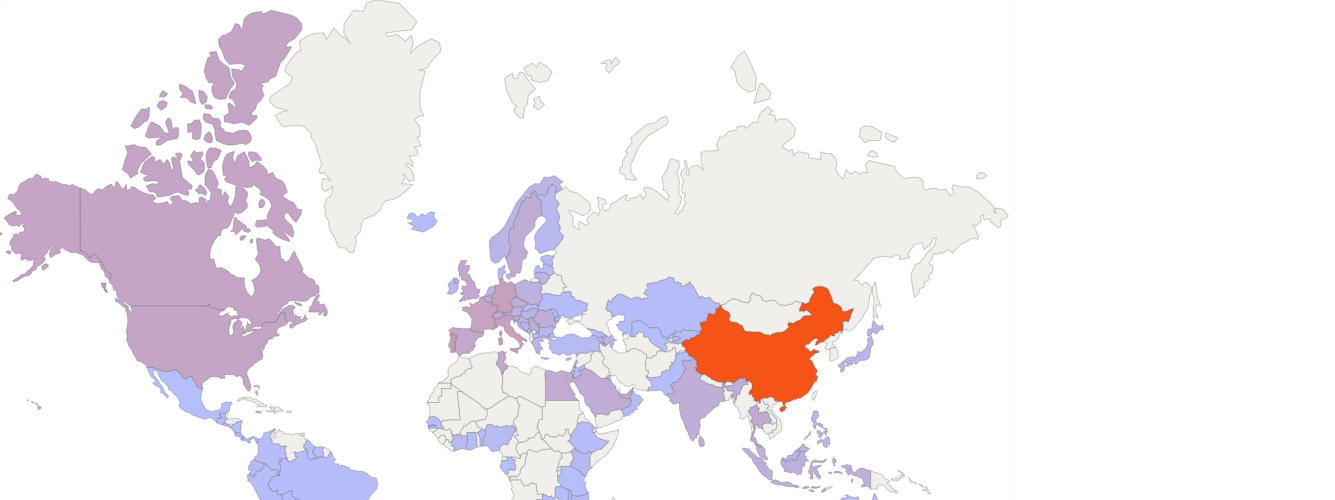
In 2023, the world imports of "Granite, merely cut, by sawing/othw., into blocks/slabs of a rect. (incl. square) shape" exceeded $451 million (according to external trade statistics of 113 countries). It was $427 million in the previous year (according to merchandise trade statistics of 116 countries).
There are no trade data (2023) for such importers as Vietnam (4.3% of the world imports in 2022), Nepal (0.529%), Korea (0.101%), French Polynesia (0.013%), Qatar (0.013%), Angola (0.006%), Dominican Republic (0.004%), Bermuda (0.003%), Rwanda (0.002%), Togo (0.001%), Morocco (0.001%)
Top importers of Granite, merely cut, by sawing/othw., into blocks/slabs of a rect. (incl. square) shape in 2023
The world's largest importers of this commodity group in 2023:
- China - 53% of the world imports ($242 million)
- Maldives - 14.4% ($65 million)
- Portugal - 2.99% ($13.5 million)
- Germany - 2.58% ($11.6 million)
- Italy - 2.14% ($9.69 million)
«Granite, merely cut, by sawing/othw., into blocks/slabs of a rect. (incl. square) shape» accounted for a substantial share of total imports of
- Maldives - 1.86% of Maldives's total imports in 2023 ($65 million of $3.48 billion)
- Tunisia - 0.02% ($5.33 million of $25 billion)
- Sri Lanka - 0.015% ($2.6 million of $16.3 billion)
According to statistics provided by the major importers, the largest flows of imports of «Granite, merely cut, by sawing/othw., into blocks/slabs of a rect. (incl. square) shape» in 2023:
- Imports to China from Angola (7.34% of the world imports, $33 million according to external trade statistics of China)
- Imports to China from Brazil (16.4% of the world imports, $74 million according to external trade statistics of China)
- Imports to China from Cambodia (7.55% of the world imports, $34 million according to external trade statistics of China)
- Imports to China from India (3.34% of the world imports, $15.1 million according to external trade statistics of China)
- Imports to China from Madagascar (2.87% of the world imports, $12.9 million according to external trade statistics of China)
- Imports to China from Norway (4.73% of the world imports, $21 million according to external trade statistics of China)
- Imports to China from Zimbabwe (3.23% of the world imports, $14.5 million according to external trade statistics of China)
- Imports to Maldives from India (9.81% of the world imports, $44 million according to external trade statistics of Maldives)
- Imports to Maldives from United Arab Emirates (4.62% of the world imports, $20 million according to external trade statistics of Maldives)
- Imports to Other Asia, nes from India (5.14% of the world imports, $23 million according to external trade statistics of Other Asia, nes)
In 2023, the world exports of "Granite, merely cut, by sawing/othw., into blocks/slabs of a rect. (incl. square) shape" exceeded $367 million (according to external trade statistics of 69 countries). It was $382 million in the previous year (according to merchandise trade statistics of 74 countries).
There are no trade data (2023) for such exporters as Cambodia (0.387% of the world exports in 2022), Albania (0.051%), Vietnam (0.034%), Korea (0.012%), Jordan (0.01%), Bolivia (0.002%), Slovenia (0.002%), Rwanda (0.002%), Brunei (0.001%)
Top exporters of Granite, merely cut, by sawing/othw., into blocks/slabs of a rect. (incl. square) shape in 2023
The world's largest exporters of this commodity group in 2023:
- India - 34% of the world exports ($126 million)
- Brazil - 32% ($120 million)
- Portugal - 7.59% ($27 million)
- Spain - 4.78% ($17.5 million)
- Italy - 3.6% ($13.2 million)
«Granite, merely cut, by sawing/othw., into blocks/slabs of a rect. (incl. square) shape» accounted for a substantial share of total exports of
- Madagascar - 0.233% of Madagascar's total exports in 2023 ($7.65 million of $3.28 billion)
- Brazil - 0.035% ($120 million of $339 billion)
- Portugal - 0.033% ($27 million of $83 billion)
- India - 0.029% ($126 million of $431 billion)
- Sri Lanka - 0.026% ($3.21 million of $12 billion)
- Namibia - 0.017% ($959 thousand of $5.48 billion)
- Samoa - 0.015% ($6.86 thousand of $42 million)
- Zimbabwe - 0.014% ($1.04 million of $7.22 billion)
According to statistics provided by the major exporters, the largest flows of exports of «Granite, merely cut, by sawing/othw., into blocks/slabs of a rect. (incl. square) shape» in 2023:
- Exports from Brazil to China: (24% of the world exports, $91 million according to external trade statistics of Brazil)
- Exports from Brazil to Italy: (4.81% of the world exports, $17.6 million according to external trade statistics of Brazil)
- Exports from India to Algeria: (5.31% of the world exports, $19.5 million according to external trade statistics of India)
- Exports from India to China: (24% of the world exports, $89 million according to external trade statistics of India)
- Exports from Portugal to Algeria: (1.86% of the world exports, $6.84 million according to external trade statistics of Portugal)
- Exports from Portugal to France: (2.36% of the world exports, $8.67 million according to external trade statistics of Portugal)
- Exports from Portugal to Spain: (2.08% of the world exports, $7.64 million according to external trade statistics of Portugal)
- Exports from Spain to France: (1.8% of the world exports, $6.61 million according to external trade statistics of Spain)
- Exports from Spain to Portugal: (1.9% of the world exports, $7.01 million according to external trade statistics of Spain)
- Exports from Turkey to Germany: (1.71% of the world exports, $6.3 million according to external trade statistics of Turkey)
| Reporter | 251612. Granite, merely cut, by sawing/othw., into blocks/slabs of a rect. (incl. square) shape | |||
| Exports | Imports | |||
| 2023 | 2023 | |||
| Value (US$) | World Share ($), % | Value (US$) | World Share ($), % | |
| India | 126,252,555.83 | 34.37 | 2,812,178.47 | 0.62 |
| Brazil | 120,353,333.00 | 32.76 | 20,109.00 | 0.00 |
| Portugal | 27,890,083.83 | 7.59 | 13,525,445.35 | 2.99 |
| Spain | 17,587,022.33 | 4.78 | 5,853,034.70 | 1.29 |
| Italy | 13,241,813.46 | 3.60 | 9,697,676.59 | 2.14 |
| Turkey | 10,052,724.00 | 2.73 | 92,694.00 | 0.02 |
| Madagascar | 7,651,662.63 | 2.08 | ||
| USA | 6,673,297.00 | 1.81 | 7,567,897.00 | 1.67 |
| Sweden | 6,102,640.23 | 1.66 | 3,273,559.89 | 0.72 |
| Canada | 4,771,420.65 | 1.29 | 7,274,716.72 | 1.61 |
| China | 3,844,429.00 | 1.04 | 242,968,944.00 | 53.80 |
| Sri Lanka | 3,213,941.28 | 0.87 | 2,604,438.72 | 0.57 |
| South Africa | 2,126,150.45 | 0.57 | 831,374.41 | 0.18 |
| Norway | 2,095,362.86 | 0.57 | 895,285.15 | 0.19 |
| France | 1,462,206.04 | 0.39 | 9,408,880.55 | 2.08 |
| Switzerland | 1,340,731.84 | 0.36 | 2,912,792.23 | 0.64 |
| Belgium | 1,317,718.02 | 0.35 | 3,164,175.56 | 0.70 |
| Uruguay | 1,130,184.00 | 0.30 | 0.69 | 0.00 |
| Zimbabwe | 1,043,974.29 | 0.28 | 88,645.81 | 0.01 |
| United Arab Emirates | 988,900.94 | 0.26 | 5,108,154.42 | 1.13 |
| Namibia | 959,744.77 | 0.26 | 308,158.25 | 0.06 |
| Malaysia | 669,505.59 | 0.18 | 1,597,506.31 | 0.35 |
| Egypt | 665,512.55 | 0.18 | 4,282,914.71 | 0.94 |
| Thailand | 548,645.65 | 0.14 | 4,724,632.79 | 1.04 |
| Greece | 539,697.93 | 0.14 | 324,579.53 | 0.07 |
| Kazakhstan | 536,013.16 | 0.14 | 53,588.87 | 0.01 |
| Germany | 523,035.58 | 0.14 | 11,683,190.69 | 2.58 |
| Poland | 374,312.00 | 0.10 | 1,606,584.00 | 0.35 |
| Australia | 364,873.27 | 0.09 | 40,446.50 | 0.00 |
| Denmark | 301,623.16 | 0.08 | 440,342.21 | 0.09 |
| Estonia | 266,536.46 | 0.07 | 125,850.42 | 0.02 |
| United Kingdom | 263,916.38 | 0.07 | 4,836,749.27 | 1.07 |
| Tunisia | 262,809.47 | 0.07 | 5,335,578.09 | 1.18 |
| Mozambique | 220,000.00 | 0.05 | 96,000.00 | 0.02 |
| Bosnia and Herzegovina | 179,828.60 | 0.04 | 1,092,457.37 | 0.24 |
| Netherlands | 174,567.57 | 0.04 | 1,752,601.27 | 0.38 |
| Uzbekistan | 161,189.99 | 0.04 | 867.00 | 0.00 |
| Finland | 160,649.48 | 0.04 | 279,610.65 | 0.06 |
| Zambia | 135,010.93 | 0.03 | 8,065.96 | 0.00 |
| Ukraine | 115,772.05 | 0.03 | 61,180.66 | 0.01 |
| Kuwait | 82,924.12 | 0.02 | 66,526.55 | 0.01 |
| Pakistan | 62,794.93 | 0.01 | 13,515.46 | 0.00 |
| Lebanon | 59,964.00 | 0.01 | 18,823.00 | 0.00 |
| Luxembourg | 58,937.16 | 0.01 | 626,157.44 | 0.13 |
| Hong Kong | 58,004.87 | 0.01 | 611,557.92 | 0.13 |
| Japan | 56,544.43 | 0.01 | 748,936.21 | 0.16 |
| Kyrgyz Republic | 54,258.00 | 0.01 | 67,334.00 | 0.01 |
| Singapore | 48,498.83 | 0.01 | 693,521.83 | 0.15 |
| Romania | 47,495.25 | 0.01 | 2,616,998.54 | 0.57 |
| Bulgaria | 46,978.75 | 0.01 | 217,522.52 | 0.04 |
| Oman | 35,048.11 | 0.00 | 128,899.87 | 0.02 |
| Lithuania | 27,419.00 | 0.00 | 1,078,755.00 | 0.23 |
| North Macedonia | 15,455.96 | 0.00 | 32,124.96 | 0.00 |
| Austria | 11,870.16 | 0.00 | 1,804,469.73 | 0.39 |
| Nigeria | 11,813.30 | 0.00 | 138,399.76 | 0.03 |
| Ireland | 8,636.09 | 0.00 | 236,122.03 | 0.05 |
| Hungary | 7,348.00 | 0.00 | 830,674.00 | 0.18 |
| Samoa | 6,862.47 | 0.00 | ||
| Serbia | 5,255.00 | 0.00 | 2,497,379.00 | 0.55 |
| Kenya | 4,104.25 | 0.00 | 382,981.57 | 0.08 |
| Czech Republic | 3,446.00 | 0.00 | 3,107,355.00 | 0.68 |
| Ethiopia | 3,249.14 | 0.00 | 20,504.17 | 0.00 |
| Saudi Arabia | 3,130.93 | 0.00 | 3,581,221.51 | 0.79 |
| Guatemala | 739.00 | 0.00 | 242.00 | 0.00 |
| El Salvador | 620.00 | 0.00 | 143,419.45 | 0.03 |
| Costa Rica | 486.00 | 0.00 | 30,625.88 | 0.00 |
| Croatia | 289.00 | 0.00 | 140,278.00 | 0.03 |
| Georgia | 245.34 | 0.00 | 56,732.30 | 0.01 |
| Slovak Republic | 42.16 | 0.00 | 39,835.01 | 0.00 |
| The Bahamas | 239,326.00 | 0.05 | ||
| Tanzania | 3,695.49 | 0.00 | ||
| Swaziland | 6,180.09 | 0.00 | ||
| Suriname | 27,463.05 | 0.00 | ||
| Slovenia | 3,154,429.20 | 0.69 | ||
| Seychelles | 56,131.59 | 0.01 | ||
| Senegal | 8,038.86 | 0.00 | ||
| São Tomé and Principe | 4,585.49 | 0.00 | ||
| Philippines | 231,557.00 | 0.05 | ||
| Peru | 28,446.04 | 0.00 | ||
| Paraguay | 23,126.42 | 0.00 | ||
| Panama | 1,707.00 | 0.00 | ||
| Nicaragua | 697.22 | 0.00 | ||
| New Zealand | 79,352.24 | 0.01 | ||
| Montenegro | 105,184.70 | 0.02 | ||
| Moldova | 1,069.00 | 0.00 | ||
| Mexico | 1,295.00 | 0.00 | ||
| Malta | 90,206.99 | 0.01 | ||
| Maldives | 65,203,615.98 | 14.43 | ||
| Malawi | 38,630.54 | 0.00 | ||
| Latvia | 17,621.43 | 0.00 | ||
| Jordan | 33,454.80 | 0.00 | ||
| Jamaica | 607.92 | 0.00 | ||
| Israel | 17,000.00 | 0.00 | ||
| Indonesia | 2,050,605.00 | 0.45 | ||
| Iceland | 9,191.56 | 0.00 | ||
| Guyana | 138.29 | 0.00 | ||
| Ghana | 14,217.40 | 0.00 | ||
| Gambia | 3,275.10 | 0.00 | ||
| Gabon | 546.14 | 0.00 | ||
| Fiji | 107,466.47 | 0.02 | ||
| Ecuador | 169,670.10 | 0.03 | ||
| Dominica | 194.44 | 0.00 | ||
| Cyprus | 12,890.88 | 0.00 | ||
| Côte d`Ivoire | 213,994.30 | 0.04 | ||
| Colombia | 31,060.94 | 0.00 | ||
| Cabo Verde | 65,336.95 | 0.01 | ||
| Brunei | 9,846.02 | 0.00 | ||
| Botswana | 154,467.06 | 0.03 | ||
| Bolivia | 6,580.00 | 0.00 | ||
| Benin | 7,021.71 | 0.00 | ||
| Bahrain | 30,444.13 | 0.00 | ||
| Azerbaijan | 440,439.63 | 0.09 | ||
| Armenia | 323,220.65 | 0.07 | ||
| Argentina | 1,848,938.21 | 0.40 | ||
| Andorra | 4,712.51 | 0.00 | ||