Self-adhesive plates, sheets, film, foil, tape, strip & other flat shapes, of plastics, in rolls of a width not >20cm | Imports and Exports | 2023
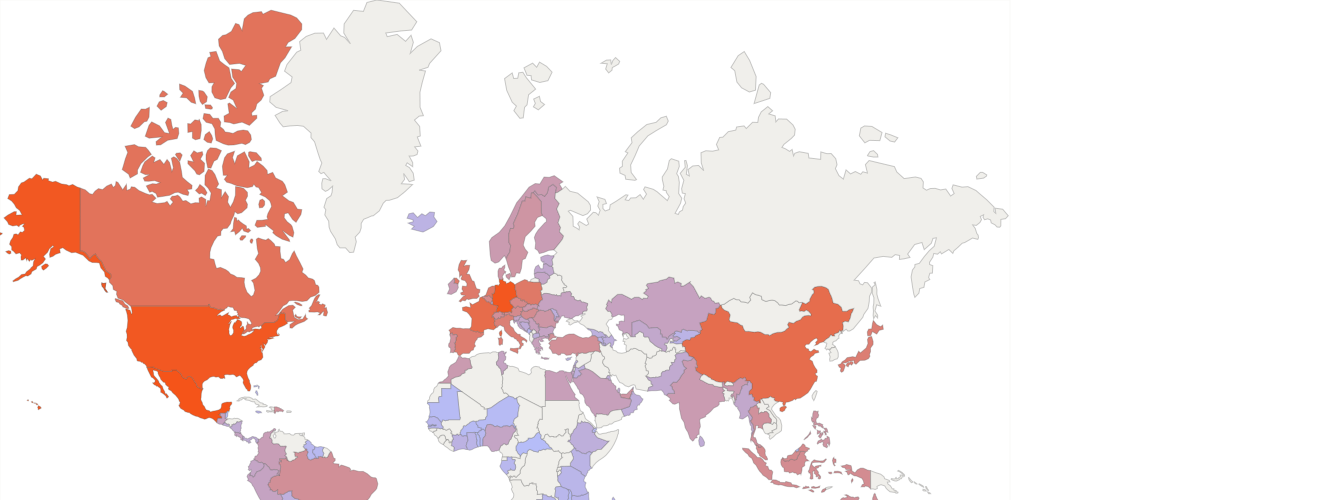
In 2023, the world exports of "Self-adhesive plates, sheets, film, foil, tape, strip & other flat shapes, of plastics, in rolls of a width not >20cm" exceeded $7.24 billion (according to external trade statistics of 119 countries). It was $7.75 billion in the previous year (according to merchandise trade statistics of 124 countries).
There are no trade data (2023) for such exporters as Korea (3.39% of the world exports in 2022), Vietnam (0.398%), Cambodia (0.02%), State of Palestine (0.001%)
Top exporters of Self-adhesive plates, sheets, film, foil, tape, strip & other flat shapes, of plastics, in rolls of a width not >20cm in 2023
The world's largest exporters of this commodity group in 2023:
- China - 24% of the world exports ($1.74 billion)
- USA - 14.8% ($1.07 billion)
- Germany - 13.4% ($978 million)
- Italy - 8.42% ($610 million)
- Japan - 3.72% ($269 million)
«Self-adhesive plates, sheets, film, foil, tape, strip & other flat shapes, of plastics, in rolls of a width not >20cm» accounted for a substantial share of total exports of
- Malta - 0.609% of Malta's total exports in 2023 ($21 million of $3.46 billion)
- Luxembourg - 0.221% ($36 million of $16.3 billion)
- El Salvador - 0.116% ($7.57 million of $6.49 billion)
- Greece - 0.108% ($59 million of $55 billion)
- Italy - 0.09% ($610 million of $677 billion)
According to statistics provided by the major exporters, the largest flows of exports of «Self-adhesive plates, sheets, film, foil, tape, strip & other flat shapes, of plastics, in rolls of a width not >20cm» in 2023:
- Exports from Canada to USA: (1.76% of the world exports, $127 million according to external trade statistics of Canada)
- Exports from China to USA: (2.42% of the world exports, $175 million according to external trade statistics of China)
- Exports from China to Vietnam: (1.15% of the world exports, $83 million according to external trade statistics of China)
- Exports from Germany to France: (1.34% of the world exports, $97 million according to external trade statistics of Germany)
- Exports from Germany to Poland: (1.14% of the world exports, $82 million according to external trade statistics of Germany)
- Exports from Italy to France: (1.24% of the world exports, $90 million according to external trade statistics of Italy)
- Exports from Italy to Germany: (2.62% of the world exports, $190 million according to external trade statistics of Italy)
- Exports from Mexico to USA: (1.13% of the world exports, $81 million according to external trade statistics of Mexico)
- Exports from USA to Canada: (3.28% of the world exports, $238 million according to external trade statistics of USA)
- Exports from USA to Mexico: (6.46% of the world exports, $468 million according to external trade statistics of USA)
In 2023, the world imports of "Self-adhesive plates, sheets, film, foil, tape, strip & other flat shapes, of plastics, in rolls of a width not >20cm" exceeded $6.93 billion (according to external trade statistics of 135 countries). It was $7.57 billion in the previous year (according to merchandise trade statistics of 139 countries).
There are no trade data (2023) for such importers as Vietnam (2.58% of the world imports in 2022), Korea (1.12%), Cambodia (0.592%), Angola (0.059%), Mongolia (0.034%), State of Palestine (0.033%), Trinidad and Tobago (0.028%), Rwanda (0.014%), Lesotho (0.013%), Nepal (0.013%), Bermuda (0.002%), Timor-Leste (0.001%), Burundi (0.001%)
Top importers of Self-adhesive plates, sheets, film, foil, tape, strip & other flat shapes, of plastics, in rolls of a width not >20cm in 2023
The world's largest importers of this commodity group in 2023:
- Mexico - 9.41% of the world imports ($652 million)
- Germany - 8.77% ($608 million)
- USA - 8.53% ($591 million)
- France - 5.06% ($351 million)
- China - 4.93% ($342 million)
- Canada - 4.01% ($278 million)
«Self-adhesive plates, sheets, film, foil, tape, strip & other flat shapes, of plastics, in rolls of a width not >20cm» accounted for a substantial share of total imports of
- Dominican Republic - 0.257% of Dominican Republic's total imports in 2023 ($80 million of $31 billion)
- Mexico - 0.108% ($652 million of $598 billion)
- Costa Rica - 0.101% ($22 million of $22 billion)
- Nicaragua - 0.1% ($10.9 million of $10.9 billion)
- Myanmar - 0.089% ($14.7 million of $16.4 billion)
- Tunisia - 0.089% ($23 million of $25 billion)
According to statistics provided by the major importers, the largest flows of imports of «Self-adhesive plates, sheets, film, foil, tape, strip & other flat shapes, of plastics, in rolls of a width not >20cm» in 2023:
- Imports to Canada from USA (2.93% of the world imports, $203 million according to external trade statistics of Canada)
- Imports to China from Japan (1.31% of the world imports, $90 million according to external trade statistics of China)
- Imports to France from Germany (1.35% of the world imports, $93 million according to external trade statistics of France)
- Imports to Germany from Italy (2.45% of the world imports, $169 million according to external trade statistics of Germany)
- Imports to Mexico from China (1.47% of the world imports, $102 million according to external trade statistics of Mexico)
- Imports to Mexico from USA (6.14% of the world imports, $426 million according to external trade statistics of Mexico)
- Imports to USA from Canada (1.7% of the world imports, $118 million according to external trade statistics of USA)
- Imports to USA from China (1.32% of the world imports, $91 million according to external trade statistics of USA)
- Imports to USA from Mexico (1.19% of the world imports, $83 million according to external trade statistics of USA)
- Imports to USA from Other Asia, nes (1.55% of the world imports, $108 million according to external trade statistics of USA)
| Reporter | 391910. Self-adhesive plates, sheets, film, foil, tape, strip & other flat shapes, of plastics, in rolls of a width not >20cm | |||
| Exports | Imports | |||
| 2023 | 2023 | |||
| Value (US$) | World Share ($), % | Value (US$) | World Share ($), % | |
| China | 1,749,621,125.00 | 24.13 | 342,295,958.00 | 4.93 |
| USA | 1,078,804,698.00 | 14.88 | 591,170,831.00 | 8.53 |
| Germany | 978,464,935.32 | 13.49 | 608,010,147.24 | 8.77 |
| Italy | 610,630,745.55 | 8.42 | 178,727,782.94 | 2.57 |
| Japan | 269,962,496.84 | 3.72 | 189,964,970.95 | 2.74 |
| Poland | 260,502,962.00 | 3.59 | 232,181,259.00 | 3.35 |
| United Kingdom | 188,062,007.51 | 2.59 | 217,079,081.31 | 3.13 |
| Netherlands | 180,632,710.09 | 2.49 | 228,699,762.68 | 3.30 |
| France | 164,669,605.18 | 2.27 | 351,147,688.03 | 5.06 |
| Belgium | 163,311,015.02 | 2.25 | 111,410,774.22 | 1.60 |
| Canada | 148,156,322.76 | 2.04 | 278,457,448.37 | 4.01 |
| Mexico | 138,416,334.00 | 1.90 | 652,122,738.00 | 9.41 |
| Spain | 118,831,439.11 | 1.63 | 202,619,823.90 | 2.92 |
| Switzerland | 116,593,020.07 | 1.60 | 89,801,874.92 | 1.29 |
| Singapore | 87,885,491.05 | 1.21 | 75,127,829.90 | 1.08 |
| Hong Kong | 75,764,964.30 | 1.04 | 83,030,834.69 | 1.19 |
| United Arab Emirates | 67,300,254.83 | 0.92 | 63,582,801.57 | 0.91 |
| Austria | 62,787,161.37 | 0.86 | 113,089,982.28 | 1.63 |
| Greece | 59,623,219.09 | 0.82 | 30,440,454.83 | 0.43 |
| Turkey | 58,025,767.00 | 0.80 | 87,885,717.00 | 1.26 |
| Indonesia | 55,168,540.11 | 0.76 | 103,305,121.00 | 1.49 |
| Denmark | 50,372,140.10 | 0.69 | 60,111,408.27 | 0.86 |
| Thailand | 50,319,159.57 | 0.69 | 79,690,825.61 | 1.14 |
| Malaysia | 46,095,640.13 | 0.63 | 111,243,295.24 | 1.60 |
| Ireland | 43,076,818.41 | 0.59 | 39,033,187.34 | 0.56 |
| Czech Republic | 40,926,533.00 | 0.56 | 119,293,752.00 | 1.72 |
| Hungary | 38,351,319.00 | 0.52 | 105,857,192.00 | 1.52 |
| Luxembourg | 36,200,155.30 | 0.49 | 16,920,642.60 | 0.24 |
| India | 31,959,021.43 | 0.44 | 43,993,177.86 | 0.63 |
| Australia | 25,049,055.79 | 0.34 | 88,086,218.71 | 1.27 |
| Sweden | 24,656,268.77 | 0.34 | 66,281,176.12 | 0.95 |
| Serbia | 21,627,964.00 | 0.29 | 30,342,333.00 | 0.43 |
| Malta | 21,132,738.84 | 0.29 | 6,853,314.06 | 0.09 |
| Brazil | 19,660,468.00 | 0.27 | 89,395,948.00 | 1.28 |
| Romania | 12,583,375.99 | 0.17 | 61,611,909.36 | 0.88 |
| Slovak Republic | 11,231,360.97 | 0.15 | 51,048,329.67 | 0.73 |
| Lithuania | 8,841,857.00 | 0.12 | 19,420,274.00 | 0.28 |
| Portugal | 8,816,126.93 | 0.12 | 76,815,639.92 | 1.10 |
| Guatemala | 8,247,195.00 | 0.11 | 25,581,755.00 | 0.36 |
| South Africa | 7,727,831.06 | 0.10 | 32,556,075.58 | 0.46 |
| El Salvador | 7,575,130.00 | 0.10 | 8,608,356.74 | 0.12 |
| Philippines | 7,571,520.00 | 0.10 | 67,084,821.00 | 0.96 |
| Dominican Republic | 7,292,018.92 | 0.10 | 80,608,627.63 | 1.16 |
| Croatia | 7,095,897.00 | 0.09 | 16,251,759.00 | 0.23 |
| Finland | 6,628,807.02 | 0.09 | 37,724,438.19 | 0.54 |
| Bulgaria | 6,574,415.18 | 0.09 | 22,031,890.06 | 0.31 |
| Norway | 5,761,375.26 | 0.07 | 44,562,572.33 | 0.64 |
| Latvia | 5,748,621.92 | 0.07 | 13,796,554.00 | 0.19 |
| Slovenia | 5,518,230.53 | 0.07 | 18,546,003.33 | 0.26 |
| Chile | 4,009,641.44 | 0.05 | 39,771,158.12 | 0.57 |
| Estonia | 3,794,879.21 | 0.05 | 13,441,672.51 | 0.19 |
| Ukraine | 3,540,869.97 | 0.04 | 24,809,202.03 | 0.35 |
| Tunisia | 3,527,108.93 | 0.04 | 23,185,935.15 | 0.33 |
| Peru | 3,513,360.92 | 0.04 | 23,494,912.59 | 0.33 |
| Colombia | 3,205,036.86 | 0.04 | 35,837,714.61 | 0.51 |
| Paraguay | 3,016,619.98 | 0.04 | 8,483,163.78 | 0.12 |
| Argentina | 2,832,153.34 | 0.03 | 36,130,516.90 | 0.52 |
| Israel | 2,658,276.00 | 0.03 | 19,347,947.00 | 0.27 |
| Morocco | 2,325,398.71 | 0.03 | 45,738,022.22 | 0.65 |
| Bosnia and Herzegovina | 2,243,325.59 | 0.03 | 8,466,321.94 | 0.12 |
| Kenya | 2,088,335.05 | 0.02 | 2,933,125.01 | 0.04 |
| New Zealand | 1,871,522.63 | 0.02 | 24,184,034.34 | 0.34 |
| Costa Rica | 1,548,477.62 | 0.02 | 22,811,279.03 | 0.32 |
| Kyrgyz Republic | 1,421,465.00 | 0.01 | 2,657,288.00 | 0.03 |
| Lebanon | 1,148,366.00 | 0.01 | 4,661,481.00 | 0.06 |
| Kazakhstan | 709,918.15 | 0.00 | 25,831,684.21 | 0.37 |
| Saudi Arabia | 697,058.38 | 0.00 | 31,415,355.74 | 0.45 |
| Djibouti | 535,017.36 | 0.00 | 561,785.04 | 0.00 |
| Egypt | 456,626.58 | 0.00 | 33,316,821.09 | 0.48 |
| Georgia | 437,011.20 | 0.00 | 5,014,699.25 | 0.07 |
| North Macedonia | 374,490.63 | 0.00 | 6,819,758.14 | 0.09 |
| Sri Lanka | 297,354.60 | 0.00 | 9,444,579.37 | 0.13 |
| Senegal | 270,835.65 | 0.00 | 1,186,337.20 | 0.01 |
| Uruguay | 261,543.00 | 0.00 | 5,696,130.53 | 0.08 |
| Jordan | 259,156.73 | 0.00 | 6,012,857.32 | 0.08 |
| Ecuador | 232,905.50 | 0.00 | 20,319,018.70 | 0.29 |
| Côte d`Ivoire | 218,279.03 | 0.00 | 3,610,710.44 | 0.05 |
| Uzbekistan | 217,605.96 | 0.00 | 15,229,188.78 | 0.21 |
| Armenia | 209,072.96 | 0.00 | 3,091,940.55 | 0.04 |
| Oman | 202,936.28 | 0.00 | 7,088,033.79 | 0.10 |
| Madagascar | 158,352.67 | 0.00 | 1,773,588.93 | 0.02 |
| China, Macao SAR | 147,499.36 | 0.00 | 1,054,422.57 | 0.01 |
| Namibia | 121,716.01 | 0.00 | 1,824,898.63 | 0.02 |
| Nigeria | 120,583.47 | 0.00 | 20,685,056.92 | 0.29 |
| Panama | 111,132.00 | 0.00 | 8,715,898.00 | 0.12 |
| Kuwait | 102,055.95 | 0.00 | 7,456,231.94 | 0.10 |
| Moldova | 96,163.00 | 0.00 | 6,202,155.00 | 0.08 |
| Azerbaijan | 88,454.60 | 0.00 | 6,219,646.86 | 0.08 |
| Mauritius | 81,169.00 | 0.00 | 482,926.21 | 0.00 |
| Bahrain | 58,123.14 | 0.00 | 3,821,573.67 | 0.05 |
| Zambia | 47,292.16 | 0.00 | 1,351,535.36 | 0.01 |
| Zimbabwe | 44,918.90 | 0.00 | 2,224,931.79 | 0.03 |
| Montenegro | 30,061.02 | 0.00 | 1,270,583.41 | 0.01 |
| Togo | 23,957.74 | 0.00 | 199,719.18 | 0.00 |
| Pakistan | 22,460.67 | 0.00 | 12,390,797.56 | 0.17 |
| Fiji | 19,740.23 | 0.00 | 1,125,699.67 | 0.01 |
| Jamaica | 15,044.66 | 0.00 | 1,522,281.41 | 0.02 |
| Nicaragua | 12,565.07 | 0.00 | 10,938,277.99 | 0.15 |
| Tanzania | 11,150.22 | 0.00 | 1,757,293.88 | 0.02 |
| Cabo Verde | 10,375.31 | 0.00 | 335,994.99 | 0.00 |
| Botswana | 8,455.63 | 0.00 | 2,382,109.00 | 0.03 |
| Andorra | 5,798.79 | 0.00 | 547,086.60 | 0.00 |
| Ghana | 4,011.11 | 0.00 | 2,245,053.66 | 0.03 |
| Cyprus | 3,999.61 | 0.00 | 3,589,443.10 | 0.05 |
| Swaziland | 3,787.87 | 0.00 | 1,406,779.23 | 0.02 |
| Gabon | 2,406.05 | 0.00 | 1,024,371.06 | 0.01 |
| Barbados | 1,950.50 | 0.00 | 634,198.00 | 0.00 |
| Guyana | 1,725.80 | 0.00 | 894,712.58 | 0.01 |
| Iceland | 973.60 | 0.00 | 3,158,602.53 | 0.04 |
| The Bahamas | 701.00 | 0.00 | 1,100,021.00 | 0.01 |
| Bolivia | 498.75 | 0.00 | 5,408,619.00 | 0.07 |
| Brunei | 478.19 | 0.00 | 336,018.80 | 0.00 |
| Aruba | 337.43 | 0.00 | 312,581.00 | 0.00 |
| Ethiopia | 258.33 | 0.00 | 6,148,653.64 | 0.08 |
| Dominica | 200.00 | 0.00 | 68,210.30 | 0.00 |
| Mauritania | 157.44 | 0.00 | 356,088.23 | 0.00 |
| Belize | 35.30 | 0.00 | 429,691.76 | 0.00 |
| Antigua and Barbuda | 30.18 | 0.00 | 135,282.68 | 0.00 |
| Saint Vincent and the Grenadines | 5.37 | 0.00 | 136,784.56 | 0.00 |
| Suriname | 729,349.88 | 0.01 | ||
| Seychelles | 300,572.65 | 0.00 | ||
| São Tomé and Principe | 48,887.84 | 0.00 | ||
| Samoa | 143,334.21 | 0.00 | ||
| Qatar | 12,291,723.02 | 0.17 | ||
| Niger | 321,554.78 | 0.00 | ||
| Myanmar | 14,744,522.84 | 0.21 | ||
| Mozambique | 1,740,000.00 | 0.02 | ||
| Montserrat | 12,907.47 | 0.00 | ||
| Maldives | 1,372,297.13 | 0.01 | ||
| Malawi | 364,010.75 | 0.00 | ||
| Gambia | 85,159.53 | 0.00 | ||
| French Polynesia | 974,490.88 | 0.01 | ||
| Central African Republic | 103,480.37 | 0.00 | ||
| Burkina Faso | 337,861.01 | 0.00 | ||
| Benin | 703,103.51 | 0.01 | ||