Mosaic cubes and the like, of marble/travertine/alabaster, whether or not on a backing; artificially coloured granules, chippings & powder, of marble/travertine/alabaster | Imports and Exports | 2023
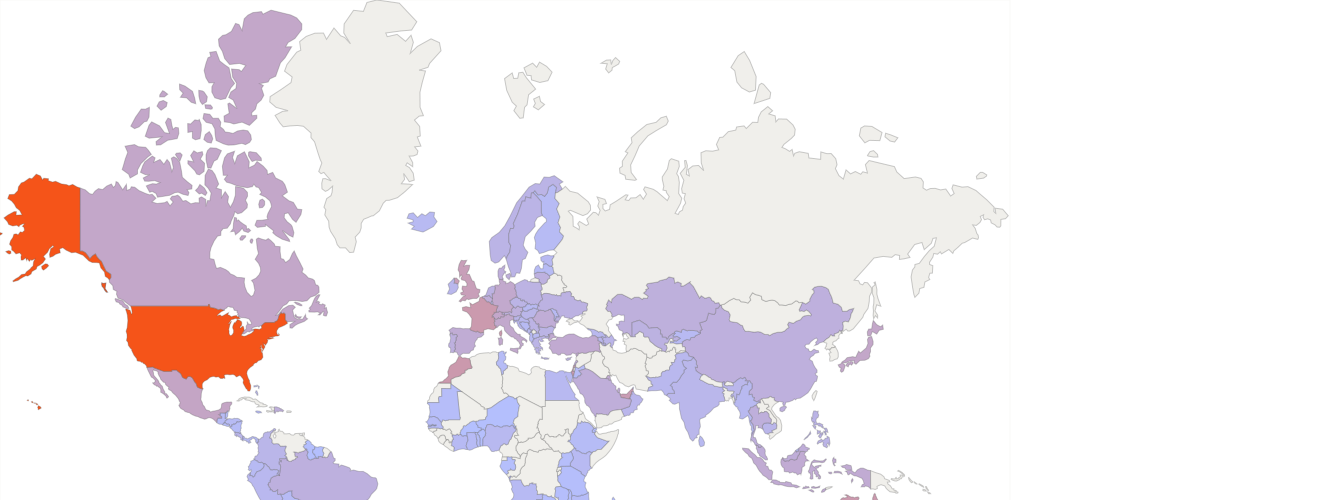
In 2023, the world exports of "Mosaic cubes and the like, of marble/travertine/alabaster, whether or not on a backing; artificially coloured granules, chippings & powder, of marble/travertine/alabaster" exceeded $3.19 billion (according to external trade statistics of 101 countries). It was $3.62 billion in the previous year (according to merchandise trade statistics of 102 countries).
There are no trade data (2023) for such exporters as Vietnam (0.399% of the world exports in 2022), State of Palestine (0.055%), Korea (0.002%)
Top exporters of Mosaic cubes and the like, of marble/travertine/alabaster, whether or not on a backing; artificially coloured granules, chippings & powder, of marble/travertine/alabaster in 2023
The world's largest exporters of this commodity group in 2023:
- China - 40% of the world exports ($1.29 billion)
- Italy - 24% ($787 million)
- Turkey - 19.6% ($627 million)
- Spain - 3.04% ($97 million)
- Brazil - 1.93% ($61 million)
«Mosaic cubes and the like, of marble/travertine/alabaster, whether or not on a backing; artificially coloured granules, chippings & powder, of marble/travertine/alabaster» accounted for a substantial share of total exports of
- Namibia - 0.259% of Namibia's total exports in 2023 ($14.2 million of $5.48 billion)
- Turkey - 0.245% ($627 million of $255 billion)
- Italy - 0.116% ($787 million of $677 billion)
- Kyrgyz Republic - 0.099% ($3.29 million of $3.3 billion)
- Egypt - 0.07% ($29 million of $42 billion)
- Portugal - 0.063% ($53 million of $83 billion)
According to statistics provided by the major exporters, the largest flows of exports of «Mosaic cubes and the like, of marble/travertine/alabaster, whether or not on a backing; artificially coloured granules, chippings & powder, of marble/travertine/alabaster» in 2023:
- Exports from China to Hong Kong: (2.51% of the world exports, $80 million according to external trade statistics of China)
- Exports from China to Korea: (2.46% of the world exports, $78 million according to external trade statistics of China)
- Exports from China to Malaysia: (2.05% of the world exports, $65 million according to external trade statistics of China)
- Exports from China to Saudi Arabia: (1.87% of the world exports, $59 million according to external trade statistics of China)
- Exports from China to United Arab Emirates: (2.03% of the world exports, $64 million according to external trade statistics of China)
- Exports from China to USA: (7.96% of the world exports, $254 million according to external trade statistics of China)
- Exports from China to Vietnam: (4.3% of the world exports, $137 million according to external trade statistics of China)
- Exports from Italy to USA: (10.1% of the world exports, $324 million according to external trade statistics of Italy)
- Exports from Turkey to France: (1.83% of the world exports, $58 million according to external trade statistics of Turkey)
- Exports from Turkey to USA: (7.22% of the world exports, $230 million according to external trade statistics of Turkey)
In 2023, the world imports of "Mosaic cubes and the like, of marble/travertine/alabaster, whether or not on a backing; artificially coloured granules, chippings & powder, of marble/travertine/alabaster" exceeded $2.34 billion (according to external trade statistics of 140 countries). It was $2.78 billion in the previous year (according to merchandise trade statistics of 138 countries).
Top importers of Mosaic cubes and the like, of marble/travertine/alabaster, whether or not on a backing; artificially coloured granules, chippings & powder, of marble/travertine/alabaster in 2023
The world's largest importers of this commodity group in 2023:
- USA - 51% of the world imports ($1.19 billion)
- Morocco - 3.94% ($92 million)
- France - 3.82% ($89 million)
- Australia - 3.72% ($87 million)
- Israel - 3.26% ($76 million)
«Mosaic cubes and the like, of marble/travertine/alabaster, whether or not on a backing; artificially coloured granules, chippings & powder, of marble/travertine/alabaster» accounted for a substantial share of total imports of
- Morocco - 0.13% of Morocco's total imports in 2023 ($92 million of $70 billion)
- Antigua and Barbuda - 0.119% ($798 thousand of $669 million)
- Israel - 0.091% ($76 million of $83 billion)
- Lebanon - 0.078% ($14.1 million of $18.1 billion)
- Saint Vincent and the Grenadines - 0.061% ($280 thousand of $456 million)
According to statistics provided by the major importers, the largest flows of imports of «Mosaic cubes and the like, of marble/travertine/alabaster, whether or not on a backing; artificially coloured granules, chippings & powder, of marble/travertine/alabaster» in 2023:
- Imports to Australia from Italy (1.34% of the world imports, $31 million according to external trade statistics of Australia)
- Imports to France from Turkey (2.33% of the world imports, $54 million according to external trade statistics of France)
- Imports to Israel from Turkey (2.41% of the world imports, $56 million according to external trade statistics of Israel)
- Imports to United Kingdom from Italy (1.52% of the world imports, $35 million according to external trade statistics of United Kingdom)
- Imports to USA from Brazil (2.4% of the world imports, $56 million according to external trade statistics of USA)
- Imports to USA from China (8.16% of the world imports, $190 million according to external trade statistics of USA)
- Imports to USA from India (3.69% of the world imports, $86 million according to external trade statistics of USA)
- Imports to USA from Italy (16% of the world imports, $375 million according to external trade statistics of USA)
- Imports to USA from Mexico (2.17% of the world imports, $50 million according to external trade statistics of USA)
- Imports to USA from Turkey (14.1% of the world imports, $331 million according to external trade statistics of USA)
| Reporter | 680291. Mosaic cubes and the like, of marble/travertine/alabaster, whether or not on a backing; artificially coloured granules, chippings & powder, of marble/travertine/alabaster | |||
| Exports | Imports | |||
| 2023 | 2023 | |||
| Value (US$) | World Share ($), % | Value (US$) | World Share ($), % | |
| China | 1,292,693,957.00 | 40.51 | 9,887,749.00 | 0.42 |
| Italy | 787,413,943.65 | 24.68 | 26,031,694.48 | 1.11 |
| Turkey | 627,642,431.00 | 19.67 | 21,231,552.00 | 0.90 |
| Spain | 97,144,862.56 | 3.04 | 17,864,513.53 | 0.76 |
| Brazil | 61,793,415.00 | 1.93 | 9,702,408.00 | 0.41 |
| Portugal | 53,557,786.54 | 1.67 | 9,692,415.14 | 0.41 |
| Mexico | 46,130,118.00 | 1.44 | 38,070,313.00 | 1.62 |
| Egypt | 29,835,677.40 | 0.93 | 1,158,897.82 | 0.04 |
| Greece | 26,813,086.22 | 0.84 | 4,547,660.11 | 0.19 |
| Namibia | 14,214,201.42 | 0.44 | 79,746.93 | 0.00 |
| USA | 13,139,946.00 | 0.41 | 1,199,621,543.00 | 51.26 |
| Poland | 12,141,004.00 | 0.38 | 6,289,798.00 | 0.26 |
| Denmark | 10,676,706.70 | 0.33 | 12,673,611.10 | 0.54 |
| France | 9,733,437.39 | 0.30 | 89,459,981.10 | 3.82 |
| India | 9,282,875.76 | 0.29 | 2,671,299.71 | 0.11 |
| Canada | 8,687,180.45 | 0.27 | 31,961,179.10 | 1.36 |
| Lithuania | 8,532,694.00 | 0.26 | 8,573,132.00 | 0.36 |
| Germany | 8,372,136.41 | 0.26 | 25,815,536.99 | 1.10 |
| Slovenia | 7,979,553.09 | 0.25 | 3,669,504.81 | 0.15 |
| United Arab Emirates | 6,688,544.83 | 0.20 | 72,310,703.65 | 3.09 |
| Netherlands | 5,557,689.35 | 0.17 | 6,678,120.43 | 0.28 |
| Belgium | 5,351,916.00 | 0.16 | 14,240,133.32 | 0.60 |
| United Kingdom | 3,718,620.63 | 0.11 | 62,115,535.02 | 2.65 |
| Jordan | 3,650,606.94 | 0.11 | 410,740.94 | 0.01 |
| Indonesia | 3,391,142.53 | 0.10 | 19,464,919.00 | 0.83 |
| Kyrgyz Republic | 3,291,084.00 | 0.10 | 819,931.00 | 0.03 |
| Lebanon | 2,904,533.00 | 0.09 | 14,195,588.00 | 0.60 |
| Hong Kong | 2,050,358.67 | 0.06 | 13,214,386.97 | 0.56 |
| Serbia | 1,985,898.00 | 0.06 | 5,711,217.00 | 0.24 |
| Tunisia | 1,951,773.68 | 0.06 | 324,514.35 | 0.01 |
| North Macedonia | 1,794,929.63 | 0.05 | 973,099.17 | 0.04 |
| Armenia | 1,742,237.98 | 0.05 | 2,782,105.58 | 0.11 |
| Switzerland | 1,590,253.02 | 0.04 | 29,879,209.45 | 1.27 |
| Sweden | 1,413,927.54 | 0.04 | 4,630,372.38 | 0.19 |
| Saudi Arabia | 1,401,883.69 | 0.04 | 13,267,901.00 | 0.56 |
| Estonia | 1,248,317.99 | 0.03 | 1,188,155.89 | 0.05 |
| Morocco | 1,246,128.09 | 0.03 | 92,434,582.96 | 3.94 |
| Singapore | 1,058,983.49 | 0.03 | 23,008,728.72 | 0.98 |
| Ukraine | 997,262.74 | 0.03 | 6,635,885.39 | 0.28 |
| Hungary | 904,382.00 | 0.02 | 3,239,483.00 | 0.13 |
| Bulgaria | 835,305.60 | 0.02 | 5,383,992.48 | 0.23 |
| Bosnia and Herzegovina | 678,262.93 | 0.02 | 725,542.20 | 0.03 |
| Austria | 672,067.91 | 0.02 | 10,487,218.93 | 0.44 |
| Romania | 643,471.69 | 0.02 | 16,359,747.01 | 0.69 |
| Malaysia | 595,117.73 | 0.01 | 14,643,715.84 | 0.62 |
| Latvia | 567,881.19 | 0.01 | 628,980.44 | 0.02 |
| Uzbekistan | 560,704.97 | 0.01 | 7,205,372.95 | 0.30 |
| Ecuador | 555,504.30 | 0.01 | 742,533.30 | 0.03 |
| Azerbaijan | 523,772.07 | 0.01 | 3,994,299.86 | 0.17 |
| Czech Republic | 499,759.00 | 0.01 | 5,323,113.00 | 0.22 |
| Philippines | 459,284.00 | 0.01 | 4,770,107.00 | 0.20 |
| Albania | 457,808.88 | 0.01 | 898,224.82 | 0.03 |
| Thailand | 414,269.36 | 0.01 | 11,348,387.66 | 0.48 |
| Finland | 256,543.95 | 0.00 | 592,201.09 | 0.02 |
| South Africa | 239,033.31 | 0.00 | 3,539,284.97 | 0.15 |
| Colombia | 222,724.08 | 0.00 | 3,309,723.53 | 0.14 |
| Kazakhstan | 214,546.90 | 0.00 | 10,814,364.09 | 0.46 |
| Croatia | 199,700.00 | 0.00 | 2,096,616.00 | 0.08 |
| Japan | 198,197.36 | 0.00 | 32,216,293.61 | 1.37 |
| Peru | 194,492.66 | 0.00 | 1,537,313.57 | 0.06 |
| Israel | 175,000.00 | 0.00 | 76,317,151.00 | 3.26 |
| Sri Lanka | 162,644.13 | 0.00 | 1,344,831.19 | 0.05 |
| Australia | 143,236.96 | 0.00 | 87,099,629.02 | 3.72 |
| Dominican Republic | 138,800.46 | 0.00 | 12,360,975.82 | 0.52 |
| Kuwait | 108,827.13 | 0.00 | 20,209,052.08 | 0.86 |
| Slovak Republic | 107,992.78 | 0.00 | 1,076,166.11 | 0.04 |
| Myanmar | 100,817.40 | 0.00 | 1,208,538.40 | 0.05 |
| Pakistan | 92,379.20 | 0.00 | 1,714,286.88 | 0.07 |
| Norway | 91,158.62 | 0.00 | 4,480,659.16 | 0.19 |
| Angola | 75,744.51 | 0.00 | 805,486.75 | 0.03 |
| Oman | 56,356.30 | 0.00 | 2,793,552.66 | 0.11 |
| Ireland | 48,401.90 | 0.00 | 2,436,488.53 | 0.10 |
| Costa Rica | 43,828.50 | 0.00 | 2,846,800.50 | 0.12 |
| Montenegro | 41,554.00 | 0.00 | 1,915,315.97 | 0.08 |
| Chile | 37,764.46 | 0.00 | 1,396,355.48 | 0.05 |
| Argentina | 33,161.78 | 0.00 | 13,396,231.84 | 0.57 |
| New Zealand | 30,284.73 | 0.00 | 3,348,562.20 | 0.14 |
| China, Macao SAR | 26,417.05 | 0.00 | 2,390,029.23 | 0.10 |
| Tanzania | 22,854.51 | 0.00 | 54,480.22 | 0.00 |
| Bahrain | 22,290.92 | 0.00 | 6,292,077.19 | 0.26 |
| Moldova | 18,593.00 | 0.00 | 893,076.00 | 0.03 |
| Brunei | 17,779.04 | 0.00 | 908,774.12 | 0.03 |
| Honduras | 17,576.30 | 0.00 | 625,833.91 | 0.02 |
| Djibouti | 16,474.64 | 0.00 | 29,774.85 | 0.00 |
| Georgia | 13,633.01 | 0.00 | 1,663,444.73 | 0.07 |
| Zambia | 13,091.72 | 0.00 | 28,676.12 | 0.00 |
| Bolivia | 10,437.56 | 0.00 | 460,531.00 | 0.01 |
| Guatemala | 9,914.00 | 0.00 | 597,908.00 | 0.02 |
| Zimbabwe | 4,806.52 | 0.00 | 24,316.76 | 0.00 |
| Kenya | 4,803.57 | 0.00 | 858,870.14 | 0.03 |
| Luxembourg | 3,353.98 | 0.00 | 2,257,087.93 | 0.09 |
| Togo | 3,297.22 | 0.00 | 212,211.27 | 0.00 |
| Nigeria | 2,085.53 | 0.00 | 1,234,124.45 | 0.05 |
| Andorra | 1,193.56 | 0.00 | 200,625.42 | 0.00 |
| Panama | 400.00 | 0.00 | 638,433.00 | 0.02 |
| Uganda | 346.29 | 0.00 | 97,294.14 | 0.00 |
| Aruba | 300.00 | 0.00 | 674,911.72 | 0.02 |
| Cyprus | 185.97 | 0.00 | 7,143,157.85 | 0.30 |
| Nicaragua | 90.00 | 0.00 | 297,069.78 | 0.01 |
| Ghana | 49.94 | 0.00 | 484,450.86 | 0.02 |
| Saint Vincent and the Grenadines | 37.03 | 0.00 | 280,382.01 | 0.01 |
| Uruguay | 1,614,616.61 | 0.06 | ||
| The Bahamas | 1,544,813.00 | 0.06 | ||
| Swaziland | 311,217.65 | 0.01 | ||
| Suriname | 5,540.27 | 0.00 | ||
| Seychelles | 300,665.74 | 0.01 | ||
| Senegal | 397,480.28 | 0.01 | ||
| São Tomé and Principe | 15,013.16 | 0.00 | ||
| Samoa | 4,215.20 | 0.00 | ||
| Qatar | 18,298,067.41 | 0.78 | ||
| Paraguay | 252,705.45 | 0.01 | ||
| Niger | 5,409.79 | 0.00 | ||
| Mozambique | 270,000.00 | 0.01 | ||
| Montserrat | 275.94 | 0.00 | ||
| Mauritius | 454,327.59 | 0.01 | ||
| Mauritania | 151,614.63 | 0.00 | ||
| Malta | 2,434,670.92 | 0.10 | ||
| Maldives | 271,531.65 | 0.01 | ||
| Malawi | 27,649.86 | 0.00 | ||
| Madagascar | 28,212.23 | 0.00 | ||
| Lesotho | 29,441.54 | 0.00 | ||
| Jamaica | 359,115.99 | 0.01 | ||
| Iceland | 864,513.47 | 0.03 | ||
| Guyana | 4,628.61 | 0.00 | ||
| Gambia | 5,039.17 | 0.00 | ||
| Gabon | 26,706.94 | 0.00 | ||
| French Polynesia | 1,565.47 | 0.00 | ||
| Fiji | 63,512.47 | 0.00 | ||
| Ethiopia | 337,555.61 | 0.01 | ||
| El Salvador | 180,656.52 | 0.00 | ||
| Dominica | 167,039.46 | 0.00 | ||
| Côte d`Ivoire | 722,124.47 | 0.03 | ||
| Cambodia | 3,131,145.80 | 0.13 | ||
| Cabo Verde | 73,974.02 | 0.00 | ||
| Burkina Faso | 1,564.44 | 0.00 | ||
| Botswana | 11,449.22 | 0.00 | ||
| Benin | 6,901.61 | 0.00 | ||
| Belize | 146,890.26 | 0.00 | ||
| Barbados | 553,991.00 | 0.02 | ||
| Antigua and Barbuda | 798,782.64 | 0.03 | ||