Mosaic cubes and the like, of granite, whether or not on a backing; artificially coloured granules, chippings & powder, of granite | Imports and Exports | 2023
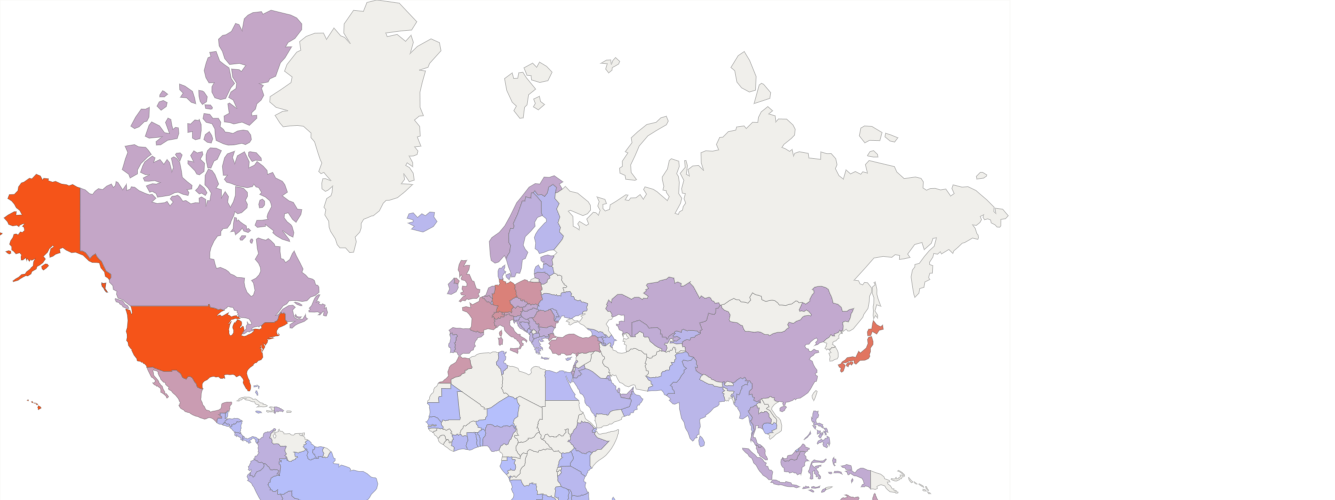
In 2023, the world exports of "Mosaic cubes and the like, of granite, whether or not on a backing; artificially coloured granules, chippings & powder, of granite" exceeded $4.75 billion (according to external trade statistics of 100 countries). It was $5.58 billion in the previous year (according to merchandise trade statistics of 91 countries).
Top exporters of Mosaic cubes and the like, of granite, whether or not on a backing; artificially coloured granules, chippings & powder, of granite in 2023
The world's largest exporters of this commodity group in 2023:
- China - 71% of the world exports ($3.38 billion)
- Italy - 8.16% ($388 million)
- Brazil - 7.17% ($341 million)
- India - 3.77% ($179 million)
- Spain - 2.27% ($108 million)
«Mosaic cubes and the like, of granite, whether or not on a backing; artificially coloured granules, chippings & powder, of granite» accounted for a substantial share of total exports of
- Djibouti - 0.494% of Djibouti's total exports in 2023 ($23 million of $4.78 billion)
- Brazil - 0.1% ($341 million of $339 billion)
- China - 0.1% ($3.38 billion of $3.37 trillion)
- Uzbekistan - 0.061% ($13 million of $21 billion)
- Italy - 0.057% ($388 million of $677 billion)
- Bosnia and Herzegovina - 0.053% ($4.94 million of $9.22 billion)
- Estonia - 0.052% ($10.5 million of $20 billion)
- Portugal - 0.048% ($41 million of $83 billion)
According to statistics provided by the major exporters, the largest flows of exports of «Mosaic cubes and the like, of granite, whether or not on a backing; artificially coloured granules, chippings & powder, of granite» in 2023:
- Exports from Brazil to USA: (4.78% of the world exports, $227 million according to external trade statistics of Brazil)
- Exports from China to Germany: (1.05% of the world exports, $49 million according to external trade statistics of China)
- Exports from China to Japan: (6.31% of the world exports, $300 million according to external trade statistics of China)
- Exports from China to Korea: (40% of the world exports, $1.92 billion according to external trade statistics of China)
- Exports from China to Other Asia, nes: (1.48% of the world exports, $70 million according to external trade statistics of China)
- Exports from China to USA: (3.88% of the world exports, $184 million according to external trade statistics of China)
- Exports from China to Vietnam: (1.71% of the world exports, $81 million according to external trade statistics of China)
- Exports from India to Vietnam: (1.33% of the world exports, $63 million according to external trade statistics of India)
- Exports from Italy to Germany: (2.1% of the world exports, $100 million according to external trade statistics of Italy)
- Exports from Italy to USA: (1.01% of the world exports, $48 million according to external trade statistics of Italy)
In 2023, the world imports of "Mosaic cubes and the like, of granite, whether or not on a backing; artificially coloured granules, chippings & powder, of granite" exceeded $2.54 billion (according to external trade statistics of 136 countries). It was $3.76 billion in the previous year (according to merchandise trade statistics of 135 countries).
Top importers of Mosaic cubes and the like, of granite, whether or not on a backing; artificially coloured granules, chippings & powder, of granite in 2023
The world's largest importers of this commodity group in 2023:
- USA - 31% of the world imports ($808 million)
- Japan - 12.6% ($322 million)
- Germany - 8.16% ($207 million)
- Switzerland - 3.54% ($89 million)
- Poland - 3.34% ($85 million)
«Mosaic cubes and the like, of granite, whether or not on a backing; artificially coloured granules, chippings & powder, of granite» accounted for a substantial share of total imports of
- Morocco - 0.091% of Morocco's total imports in 2023 ($64 million of $70 billion)
- Albania - 0.07% ($6.11 million of $8.66 billion)
- Montenegro - 0.046% ($1.92 million of $4.11 billion)
- Japan - 0.042% ($322 million of $751 billion)
- Andorra - 0.041% ($837 thousand of $1.99 billion)
According to statistics provided by the major importers, the largest flows of imports of «Mosaic cubes and the like, of granite, whether or not on a backing; artificially coloured granules, chippings & powder, of granite» in 2023:
- Imports to Germany from China (2.57% of the world imports, $65 million according to external trade statistics of Germany)
- Imports to Germany from India (1.96% of the world imports, $49 million according to external trade statistics of Germany)
- Imports to Germany from Italy (1.68% of the world imports, $42 million according to external trade statistics of Germany)
- Imports to Japan from China (12.4% of the world imports, $317 million according to external trade statistics of Japan)
- Imports to Switzerland from Italy (1.76% of the world imports, $44 million according to external trade statistics of Switzerland)
- Imports to USA from Brazil (12.9% of the world imports, $327 million according to external trade statistics of USA)
- Imports to USA from Canada (1.47% of the world imports, $37 million according to external trade statistics of USA)
- Imports to USA from China (6.32% of the world imports, $160 million according to external trade statistics of USA)
- Imports to USA from India (7.28% of the world imports, $185 million according to external trade statistics of USA)
- Imports to USA from Italy (1.92% of the world imports, $48 million according to external trade statistics of USA)
| Reporter | 680293. Mosaic cubes and the like, of granite, whether or not on a backing; artificially coloured granules, chippings & powder, of granite | |||
| Exports | Imports | |||
| 2023 | 2023 | |||
| Value (US$) | World Share ($), % | Value (US$) | World Share ($), % | |
| China | 3,380,641,998.00 | 71.02 | 16,267,077.00 | 0.64 |
| Italy | 388,468,249.69 | 8.16 | 44,637,429.63 | 1.75 |
| Brazil | 341,445,734.00 | 7.17 | 50,579.00 | 0.00 |
| India | 179,780,597.89 | 3.77 | 2,255,476.30 | 0.08 |
| Spain | 108,413,199.65 | 2.27 | 23,303,775.98 | 0.91 |
| Canada | 41,023,613.84 | 0.86 | 23,157,637.44 | 0.91 |
| Portugal | 41,009,745.30 | 0.86 | 8,674,521.83 | 0.34 |
| Germany | 35,852,556.76 | 0.75 | 207,514,839.64 | 8.16 |
| Djibouti | 23,653,805.48 | 0.49 | 530,710.66 | 0.02 |
| South Africa | 22,321,246.32 | 0.46 | 1,558,233.52 | 0.06 |
| Austria | 18,801,403.68 | 0.39 | 45,004,060.79 | 1.77 |
| Poland | 18,009,965.00 | 0.37 | 85,045,228.00 | 3.34 |
| Belgium | 16,648,673.75 | 0.34 | 34,297,675.29 | 1.34 |
| France | 16,546,892.65 | 0.34 | 66,167,227.62 | 2.60 |
| Uzbekistan | 13,028,461.94 | 0.27 | 11,565,996.97 | 0.45 |
| Egypt | 12,265,144.40 | 0.25 | 547,437.92 | 0.02 |
| Netherlands | 11,674,618.39 | 0.24 | 24,809,742.00 | 0.97 |
| Estonia | 10,579,758.55 | 0.22 | 8,695,353.17 | 0.34 |
| Turkey | 8,982,421.00 | 0.18 | 51,623,327.00 | 2.03 |
| Denmark | 8,398,359.69 | 0.17 | 5,339,890.93 | 0.21 |
| Cambodia | 7,754,758.76 | 0.16 | 318,667.36 | 0.01 |
| USA | 5,102,727.00 | 0.10 | 808,441,699.00 | 31.81 |
| Bosnia and Herzegovina | 4,940,433.27 | 0.10 | 5,068,621.41 | 0.19 |
| Slovak Republic | 3,413,436.36 | 0.07 | 17,174,226.32 | 0.67 |
| Thailand | 3,348,091.57 | 0.07 | 11,963,790.63 | 0.47 |
| Ukraine | 2,989,624.87 | 0.06 | 1,586,125.59 | 0.06 |
| North Macedonia | 2,847,173.27 | 0.05 | 4,745,977.61 | 0.18 |
| United Arab Emirates | 2,760,467.82 | 0.05 | 9,572,667.11 | 0.37 |
| Switzerland | 2,740,965.78 | 0.05 | 89,960,565.34 | 3.54 |
| Japan | 2,377,635.28 | 0.04 | 322,158,508.78 | 12.67 |
| Greece | 2,334,399.48 | 0.04 | 4,100,935.06 | 0.16 |
| Finland | 1,977,672.74 | 0.04 | 1,683,386.02 | 0.06 |
| Czech Republic | 1,873,728.00 | 0.03 | 15,897,656.00 | 0.62 |
| Sweden | 1,269,160.67 | 0.02 | 7,433,345.67 | 0.29 |
| Bulgaria | 1,266,389.27 | 0.02 | 10,057,328.42 | 0.39 |
| Lithuania | 1,245,019.00 | 0.02 | 11,929,046.00 | 0.46 |
| Serbia | 1,156,116.00 | 0.02 | 10,869,448.00 | 0.42 |
| Tanzania | 1,029,448.42 | 0.02 | 1,181,697.25 | 0.04 |
| Mexico | 927,651.00 | 0.01 | 52,023,412.00 | 2.04 |
| United Kingdom | 900,940.88 | 0.01 | 51,303,339.54 | 2.01 |
| Luxembourg | 887,434.43 | 0.01 | 4,720,432.71 | 0.18 |
| Slovenia | 859,366.15 | 0.01 | 7,996,133.61 | 0.31 |
| Mozambique | 798,000.00 | 0.01 | 698,000.00 | 0.02 |
| Romania | 784,963.88 | 0.01 | 43,245,642.45 | 1.70 |
| Angola | 755,758.98 | 0.01 | 118,729.45 | 0.00 |
| Armenia | 739,563.95 | 0.01 | 3,748,056.79 | 0.14 |
| Malaysia | 602,877.86 | 0.01 | 16,716,168.61 | 0.65 |
| Uganda | 597,674.68 | 0.01 | 297,910.49 | 0.01 |
| Hungary | 448,596.00 | 0.00 | 11,959,523.00 | 0.47 |
| Indonesia | 441,571.91 | 0.00 | 13,620,186.00 | 0.53 |
| Norway | 377,376.20 | 0.00 | 17,908,114.07 | 0.70 |
| Australia | 359,089.96 | 0.00 | 41,845,402.39 | 1.64 |
| Zambia | 338,133.47 | 0.00 | 196,395.00 | 0.00 |
| Kazakhstan | 204,961.75 | 0.00 | 15,138,850.24 | 0.59 |
| Singapore | 182,693.97 | 0.00 | 15,852,974.84 | 0.62 |
| Hong Kong | 173,317.25 | 0.00 | 8,583,372.99 | 0.33 |
| Namibia | 164,262.41 | 0.00 | 335,560.83 | 0.01 |
| Albania | 161,685.02 | 0.00 | 6,113,257.20 | 0.24 |
| Brunei | 153,696.05 | 0.00 | 267,744.36 | 0.01 |
| Philippines | 100,135.00 | 0.00 | 9,721,710.00 | 0.38 |
| Ireland | 97,576.92 | 0.00 | 13,962,841.22 | 0.54 |
| Lebanon | 70,940.00 | 0.00 | 6,797,011.00 | 0.26 |
| Uruguay | 66,838.00 | 0.00 | 2,044,243.00 | 0.08 |
| Guatemala | 66,283.00 | 0.00 | 1,248,947.00 | 0.04 |
| Croatia | 62,947.00 | 0.00 | 10,050,730.00 | 0.39 |
| Kenya | 60,758.41 | 0.00 | 523,035.41 | 0.02 |
| New Zealand | 48,459.75 | 0.00 | 3,850,947.98 | 0.15 |
| Kyrgyz Republic | 44,197.00 | 0.00 | 2,079,563.00 | 0.08 |
| Latvia | 30,256.05 | 0.00 | 1,488,408.42 | 0.05 |
| Dominican Republic | 27,555.74 | 0.00 | 10,993,590.71 | 0.43 |
| Azerbaijan | 18,728.61 | 0.00 | 1,033,163.57 | 0.04 |
| Tunisia | 17,175.14 | 0.00 | 1,212,647.38 | 0.04 |
| Pakistan | 16,522.67 | 0.00 | 527,349.29 | 0.02 |
| Kuwait | 15,837.39 | 0.00 | 3,398,323.63 | 0.13 |
| Oman | 15,009.10 | 0.00 | 1,255,162.54 | 0.04 |
| Morocco | 12,661.69 | 0.00 | 64,461,571.01 | 2.53 |
| Jordan | 10,883.64 | 0.00 | 4,378,319.98 | 0.17 |
| Côte d`Ivoire | 10,720.53 | 0.00 | 493,699.85 | 0.01 |
| Sri Lanka | 7,749.72 | 0.00 | 1,223,517.83 | 0.04 |
| El Salvador | 7,100.00 | 0.00 | 797,941.77 | 0.03 |
| Montenegro | 6,784.02 | 0.00 | 1,929,506.80 | 0.07 |
| Israel | 6,000.00 | 0.00 | 19,965,664.00 | 0.78 |
| Moldova | 5,365.00 | 0.00 | 2,629,000.00 | 0.10 |
| Costa Rica | 4,040.43 | 0.00 | 2,019,024.70 | 0.07 |
| Georgia | 2,250.21 | 0.00 | 1,451,553.18 | 0.05 |
| Ghana | 1,951.10 | 0.00 | 261,635.40 | 0.01 |
| Ethiopia | 1,913.38 | 0.00 | 5,640,946.35 | 0.22 |
| Zimbabwe | 1,854.78 | 0.00 | 113,250.69 | 0.00 |
| Andorra | 1,821.97 | 0.00 | 837,091.45 | 0.03 |
| Chile | 1,273.05 | 0.00 | 3,993,303.12 | 0.15 |
| Nicaragua | 1,120.00 | 0.00 | 360,493.91 | 0.01 |
| Iceland | 952.94 | 0.00 | 1,181,923.09 | 0.04 |
| Barbados | 873.00 | 0.00 | 203,288.00 | 0.00 |
| Peru | 804.87 | 0.00 | 3,563,933.02 | 0.14 |
| Malawi | 573.46 | 0.00 | 345,957.13 | 0.01 |
| Mauritius | 499.08 | 0.00 | 418,111.35 | 0.01 |
| Colombia | 291.76 | 0.00 | 6,965,778.64 | 0.27 |
| Botswana | 147.09 | 0.00 | 411,068.98 | 0.01 |
| Malta | 124.34 | 0.00 | 464,182.13 | 0.01 |
| Benin | 16.15 | 0.00 | 41,629.57 | 0.00 |
| Togo | 148,219.37 | 0.00 | ||
| The Bahamas | 930,900.00 | 0.03 | ||
| Swaziland | 81,579.14 | 0.00 | ||
| Suriname | 159,262.44 | 0.00 | ||
| Seychelles | 114,780.53 | 0.00 | ||
| Senegal | 67,514.29 | 0.00 | ||
| Saudi Arabia | 1,706,719.69 | 0.06 | ||
| São Tomé and Principe | 3,914.10 | 0.00 | ||
| Samoa | 78,174.98 | 0.00 | ||
| Saint Vincent and the Grenadines | 35,861.88 | 0.00 | ||
| Qatar | 7,454,140.88 | 0.29 | ||
| Paraguay | 1,167,880.74 | 0.04 | ||
| Panama | 602,209.00 | 0.02 | ||
| Nigeria | 3,896,734.87 | 0.15 | ||
| Niger | 11,417.84 | 0.00 | ||
| Myanmar | 2,218,330.36 | 0.08 | ||
| Mauritania | 150,136.14 | 0.00 | ||
| Maldives | 4,674.84 | 0.00 | ||
| Madagascar | 42,445.47 | 0.00 | ||
| Lesotho | 501,919.50 | 0.01 | ||
| Jamaica | 880,889.37 | 0.03 | ||
| Honduras | 1,108,485.40 | 0.04 | ||
| Guyana | 13,308.64 | 0.00 | ||
| Gabon | 23,897.49 | 0.00 | ||
| Fiji | 10,933.61 | 0.00 | ||
| Ecuador | 3,949,011.90 | 0.15 | ||
| Dominica | 126,264.68 | 0.00 | ||
| Cyprus | 1,472,034.77 | 0.05 | ||
| China, Macao SAR | 282,525.57 | 0.01 | ||
| Cabo Verde | 191,221.30 | 0.00 | ||
| Bolivia | 2,269,641.00 | 0.08 | ||
| Belize | 146,982.16 | 0.00 | ||
| Bahrain | 469,445.22 | 0.01 | ||
| Aruba | 74,691.06 | 0.00 | ||
| Argentina | 8,317,965.22 | 0.32 | ||
| Antigua and Barbuda | 37,573.43 | 0.00 | ||