Natural or artificial abrasive powder or grain, on a base of textile material, of paper, of paperboard or of other materials | Imports and Exports | 2023
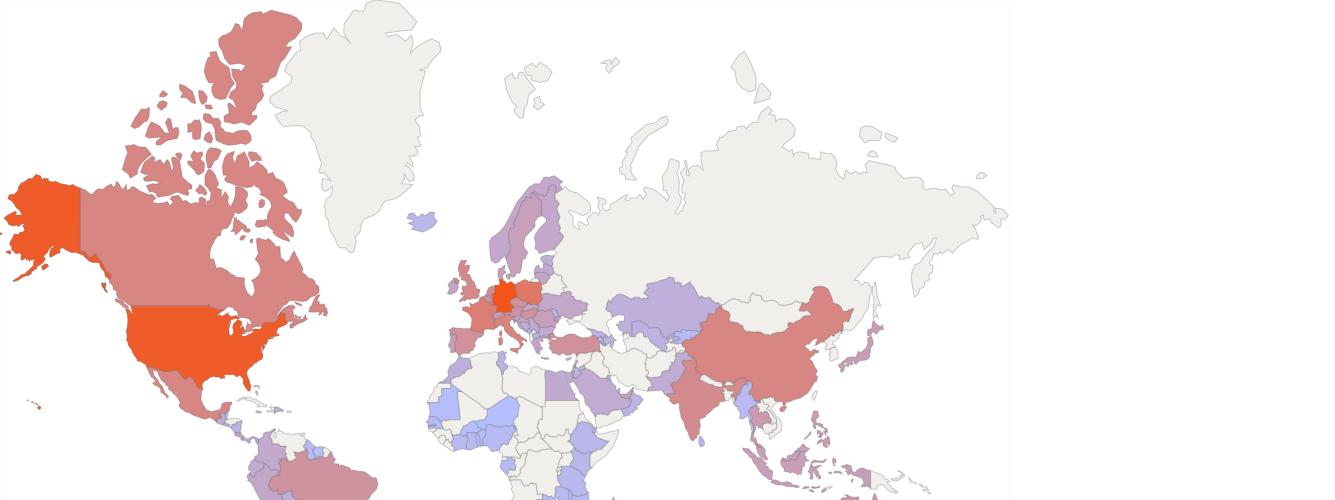
In 2023, the world imports of "Natural or artificial abrasive powder or grain, on a base of textile material, of paper, of paperboard or of other materials, whether or not cut to shape or sewn or otherwise made up" exceeded $4.62 billion (according to external trade statistics of 134 countries). It was $4.75 billion in the previous year (according to merchandise trade statistics of 140 countries).
There are no trade data (2023) for such importers as Vietnam (1.76% of the world imports in 2022), Korea (1.27%), Cambodia (0.063%), Angola (0.045%), Trinidad and Tobago (0.038%), State of Palestine (0.029%), Nepal (0.027%), Rwanda (0.013%), Mongolia (0.004%), Bermuda (0.004%), Burundi (0.001%), Albania (0.001%), Lesotho (0.001%)
Top importers of Natural or artificial abrasive powder or grain, on a base of textile material, of paper, of paperboard or of other materials, whether or not cut to shape or sewn or otherwise made up in 2023
The world's largest importers of this commodity group in 2023:
- Germany - 16.1% of the world imports ($745 million)
- USA - 13.4% ($620 million)
- Poland - 5.68% ($262 million)
- France - 4.53% ($209 million)
- Italy - 3.71% ($171 million)
«Natural or artificial abrasive powder or grain, on a base of textile material, of paper, of paperboard or of other materials, whether or not cut to shape or sewn or otherwise made up» accounted for a substantial share of total imports of
- Costa Rica - 0.087% of Costa Rica's total imports in 2023 ($19.6 million of $22 billion)
- Poland - 0.077% ($262 million of $341 billion)
- Bolivia - 0.059% ($6.79 million of $11.4 billion)
- Panama - 0.058% ($8.49 million of $14.5 billion)
- Bosnia and Herzegovina - 0.055% ($8.58 million of $15.3 billion)
- Hungary - 0.052% ($77 million of $148 billion)
According to statistics provided by the major importers, the largest flows of imports of «Natural or artificial abrasive powder or grain, on a base of textile material, of paper, of paperboard or of other materials, whether or not cut to shape or sewn or otherwise made up» in 2023:
- Imports to Canada from USA (1.51% of the world imports, $69 million according to external trade statistics of Canada)
- Imports to France from Germany (1.41% of the world imports, $65 million according to external trade statistics of France)
- Imports to Germany from Switzerland (4.03% of the world imports, $186 million according to external trade statistics of Germany)
- Imports to Germany from USA (4.32% of the world imports, $199 million according to external trade statistics of Germany)
- Imports to India from China (1.33% of the world imports, $61 million according to external trade statistics of India)
- Imports to Italy from Germany (1.37% of the world imports, $63 million according to external trade statistics of Italy)
- Imports to Mexico from USA (1.82% of the world imports, $84 million according to external trade statistics of Mexico)
- Imports to USA from Canada (2.26% of the world imports, $104 million according to external trade statistics of USA)
- Imports to USA from Germany (1.53% of the world imports, $70 million according to external trade statistics of USA)
- Imports to USA from Mexico (3.37% of the world imports, $155 million according to external trade statistics of USA)
In 2023, the world exports of "Natural or artificial abrasive powder or grain, on a base of textile material, of paper, of paperboard or of other materials, whether or not cut to shape or sewn or otherwise made up" exceeded $4.64 billion (according to external trade statistics of 116 countries). It was $4.87 billion in the previous year (according to merchandise trade statistics of 116 countries).
Top exporters of Natural or artificial abrasive powder or grain, on a base of textile material, of paper, of paperboard or of other materials, whether or not cut to shape or sewn or otherwise made up in 2023
The world's largest exporters of this commodity group in 2023:
- Germany - 21% of the world exports ($995 million)
- China - 13% ($604 million)
- USA - 12.7% ($591 million)
- Poland - 6.58% ($305 million)
- Italy - 4.76% ($221 million)
«Natural or artificial abrasive powder or grain, on a base of textile material, of paper, of paperboard or of other materials, whether or not cut to shape or sewn or otherwise made up» accounted for a substantial share of total exports of
- Finland - 0.194% of Finland's total exports in 2023 ($160 million of $82 billion)
- Poland - 0.086% ($305 million of $354 billion)
- Portugal - 0.085% ($71 million of $83 billion)
- Slovenia - 0.06% ($36 million of $59 billion)
- Germany - 0.058% ($995 million of $1.69 trillion)
According to statistics provided by the major exporters, the largest flows of exports of «Natural or artificial abrasive powder or grain, on a base of textile material, of paper, of paperboard or of other materials, whether or not cut to shape or sewn or otherwise made up» in 2023:
- Exports from Canada to USA: (1.72% of the world exports, $80 million according to external trade statistics of Canada)
- Exports from Finland to Belgium: (1.94% of the world exports, $90 million according to external trade statistics of Finland)
- Exports from Germany to France: (1.48% of the world exports, $68 million according to external trade statistics of Germany)
- Exports from Germany to Poland: (3.14% of the world exports, $146 million according to external trade statistics of Germany)
- Exports from Germany to USA: (1.6% of the world exports, $74 million according to external trade statistics of Germany)
- Exports from Mexico to USA: (3.56% of the world exports, $165 million according to external trade statistics of Mexico)
- Exports from Poland to Germany: (2.87% of the world exports, $133 million according to external trade statistics of Poland)
- Exports from USA to Canada: (2.61% of the world exports, $121 million according to external trade statistics of USA)
- Exports from USA to Germany: (2.53% of the world exports, $117 million according to external trade statistics of USA)
- Exports from USA to Mexico: (2.08% of the world exports, $96 million according to external trade statistics of USA)
| Reporter | 6805. Natural or artificial abrasive powder or grain, on a base of textile material, of paper, of paperboard or of other materials, whether or not cut to shape or sewn or otherwise made up | |||
| Exports | Imports | |||
| 2023 | 2023 | |||
| Value (US$) | World Share ($), % | Value (US$) | World Share ($), % | |
| Germany | 995,144,294.19 | 21.42 | 745,479,995.89 | 16.12 |
| China | 604,454,776.00 | 13.01 | 157,677,242.00 | 3.41 |
| USA | 591,927,434.00 | 12.74 | 620,352,937.00 | 13.41 |
| Poland | 305,857,191.00 | 6.58 | 262,927,819.00 | 5.68 |
| Italy | 221,135,052.79 | 4.76 | 171,685,175.50 | 3.71 |
| Mexico | 195,103,097.00 | 4.20 | 158,597,785.00 | 3.43 |
| Finland | 160,561,426.69 | 3.45 | 17,941,815.67 | 0.38 |
| United Kingdom | 128,463,353.85 | 2.76 | 136,595,442.80 | 2.95 |
| Japan | 128,417,886.86 | 2.76 | 45,830,171.55 | 0.99 |
| France | 121,283,028.17 | 2.61 | 209,729,189.11 | 4.53 |
| Netherlands | 115,462,840.32 | 2.48 | 109,006,555.11 | 2.35 |
| Turkey | 107,002,154.00 | 2.30 | 92,624,710.00 | 2.00 |
| Switzerland | 102,050,516.89 | 2.19 | 58,628,596.73 | 1.26 |
| Canada | 98,002,466.63 | 2.10 | 157,281,803.24 | 3.40 |
| Austria | 80,453,308.69 | 1.73 | 64,855,226.00 | 1.40 |
| Spain | 79,053,450.97 | 1.70 | 94,793,814.99 | 2.05 |
| Portugal | 71,500,452.09 | 1.53 | 43,906,187.13 | 0.94 |
| Belgium | 67,618,767.46 | 1.45 | 70,967,773.57 | 1.53 |
| Czech Republic | 60,583,699.00 | 1.30 | 87,845,085.00 | 1.90 |
| Brazil | 38,853,094.00 | 0.83 | 84,712,488.00 | 1.83 |
| Hungary | 37,655,958.00 | 0.81 | 77,501,684.00 | 1.67 |
| Thailand | 37,109,637.64 | 0.79 | 52,602,849.79 | 1.13 |
| Slovenia | 36,103,141.78 | 0.77 | 25,437,709.98 | 0.55 |
| Sweden | 26,872,540.36 | 0.57 | 35,672,311.95 | 0.77 |
| Denmark | 24,738,142.39 | 0.53 | 37,101,558.12 | 0.80 |
| Singapore | 24,685,508.56 | 0.53 | 30,609,889.35 | 0.66 |
| Malaysia | 21,147,430.82 | 0.45 | 33,902,450.57 | 0.73 |
| Lithuania | 18,732,079.00 | 0.40 | 24,080,751.00 | 0.52 |
| United Arab Emirates | 14,326,844.78 | 0.30 | 45,962,766.98 | 0.99 |
| Hong Kong | 13,941,064.17 | 0.30 | 16,947,040.81 | 0.36 |
| Israel | 11,390,325.00 | 0.24 | 13,173,852.00 | 0.28 |
| Latvia | 10,000,901.07 | 0.21 | 12,894,929.51 | 0.27 |
| Greece | 9,901,485.99 | 0.21 | 21,142,653.00 | 0.45 |
| Ukraine | 9,427,820.61 | 0.20 | 19,692,748.59 | 0.42 |
| Colombia | 9,355,588.06 | 0.20 | 15,592,315.39 | 0.33 |
| Ireland | 8,174,648.10 | 0.17 | 20,331,648.55 | 0.43 |
| India | 6,847,137.91 | 0.14 | 127,629,216.25 | 2.76 |
| Serbia | 5,294,369.00 | 0.11 | 13,666,766.00 | 0.29 |
| Estonia | 4,039,785.91 | 0.08 | 7,482,749.87 | 0.16 |
| Bulgaria | 3,806,135.89 | 0.08 | 12,956,647.17 | 0.28 |
| Australia | 3,515,646.69 | 0.07 | 69,655,479.82 | 1.50 |
| South Africa | 3,371,544.70 | 0.07 | 28,917,971.48 | 0.62 |
| Luxembourg | 3,201,885.22 | 0.06 | 6,467,376.88 | 0.13 |
| Slovak Republic | 2,726,183.10 | 0.05 | 21,000,030.42 | 0.45 |
| Costa Rica | 2,664,692.50 | 0.05 | 19,653,677.84 | 0.42 |
| Morocco | 2,642,009.96 | 0.05 | 7,640,953.82 | 0.16 |
| Guatemala | 2,601,915.00 | 0.05 | 11,433,870.00 | 0.24 |
| Croatia | 2,573,259.00 | 0.05 | 16,897,272.00 | 0.36 |
| Romania | 2,555,132.29 | 0.05 | 35,941,727.34 | 0.77 |
| Indonesia | 2,106,058.81 | 0.04 | 37,622,059.00 | 0.81 |
| New Zealand | 1,965,329.68 | 0.04 | 17,389,372.22 | 0.37 |
| Saudi Arabia | 988,187.97 | 0.02 | 13,156,049.53 | 0.28 |
| Chile | 960,203.48 | 0.02 | 18,675,913.40 | 0.40 |
| Paraguay | 839,086.14 | 0.01 | 5,933,822.73 | 0.12 |
| Argentina | 672,479.57 | 0.01 | 18,112,211.62 | 0.39 |
| Tunisia | 623,369.59 | 0.01 | 5,298,346.67 | 0.11 |
| Lebanon | 543,866.00 | 0.01 | 5,310,371.00 | 0.11 |
| El Salvador | 445,579.00 | 0.00 | 6,542,984.04 | 0.14 |
| Azerbaijan | 444,336.27 | 0.00 | 3,945,782.61 | 0.08 |
| Armenia | 367,467.25 | 0.00 | 2,156,076.02 | 0.04 |
| Georgia | 363,377.81 | 0.00 | 3,055,861.94 | 0.06 |
| Peru | 319,523.32 | 0.00 | 19,624,473.04 | 0.42 |
| Bahrain | 297,569.63 | 0.00 | 2,541,472.52 | 0.05 |
| Kazakhstan | 242,222.12 | 0.00 | 7,016,866.32 | 0.15 |
| Dominican Republic | 206,939.65 | 0.00 | 9,318,892.02 | 0.20 |
| Egypt | 192,748.08 | 0.00 | 13,955,519.01 | 0.30 |
| Bosnia and Herzegovina | 177,142.99 | 0.00 | 8,582,396.07 | 0.18 |
| Kenya | 175,309.01 | 0.00 | 2,113,000.16 | 0.04 |
| Côte d`Ivoire | 161,541.53 | 0.00 | 586,551.29 | 0.01 |
| Kuwait | 117,772.89 | 0.00 | 4,728,454.32 | 0.10 |
| Ecuador | 116,329.50 | 0.00 | 12,206,869.60 | 0.26 |
| Djibouti | 101,219.83 | 0.00 | 147,670.07 | 0.00 |
| Uruguay | 58,526.00 | 0.00 | 3,381,969.46 | 0.07 |
| Kyrgyz Republic | 35,357.00 | 0.00 | 658,200.00 | 0.01 |
| Sri Lanka | 34,885.23 | 0.00 | 1,905,321.05 | 0.04 |
| Pakistan | 28,087.16 | 0.00 | 10,978,284.90 | 0.23 |
| Nicaragua | 27,964.67 | 0.00 | 4,036,714.59 | 0.08 |
| Qatar | 22,963.77 | 0.00 | 4,631,108.75 | 0.10 |
| Moldova | 20,979.00 | 0.00 | 1,345,706.00 | 0.02 |
| Mauritius | 18,743.59 | 0.00 | 2,012,312.43 | 0.04 |
| Jordan | 18,725.40 | 0.00 | 3,304,153.97 | 0.07 |
| Benin | 16,214.93 | 0.00 | 60,184.30 | 0.00 |
| Mozambique | 16,000.00 | 0.00 | 644,000.00 | 0.01 |
| Oman | 15,388.81 | 0.00 | 3,355,237.96 | 0.07 |
| Philippines | 13,180.00 | 0.00 | 52,928,206.00 | 1.14 |
| Namibia | 10,878.97 | 0.00 | 884,586.77 | 0.01 |
| Fiji | 6,914.72 | 0.00 | 382,226.31 | 0.00 |
| Madagascar | 6,351.89 | 0.00 | 449,505.58 | 0.00 |
| Tanzania | 6,062.33 | 0.00 | 1,249,164.02 | 0.02 |
| Botswana | 4,925.21 | 0.00 | 409,760.94 | 0.00 |
| Malta | 4,193.16 | 0.00 | 1,076,781.35 | 0.02 |
| North Macedonia | 4,144.16 | 0.00 | 1,831,726.50 | 0.03 |
| Uzbekistan | 4,092.00 | 0.00 | 3,935,837.81 | 0.08 |
| Andorra | 2,803.45 | 0.00 | 145,774.65 | 0.00 |
| Ghana | 2,336.57 | 0.00 | 901,041.11 | 0.01 |
| Zambia | 2,290.32 | 0.00 | 434,821.76 | 0.00 |
| Antigua and Barbuda | 2,028.61 | 0.00 | 183,839.68 | 0.00 |
| Bolivia | 1,136.83 | 0.00 | 6,798,209.00 | 0.14 |
| Guyana | 850.49 | 0.00 | 646,101.93 | 0.01 |
| Swaziland | 790.09 | 0.00 | 159,950.43 | 0.00 |
| Brunei | 548.53 | 0.00 | 176,601.59 | 0.00 |
| Senegal | 540.90 | 0.00 | 399,561.80 | 0.00 |
| Jamaica | 458.39 | 0.00 | 2,180,991.74 | 0.04 |
| Zimbabwe | 377.39 | 0.00 | 477,846.94 | 0.01 |
| Barbados | 367.00 | 0.00 | 556,000.50 | 0.01 |
| Gabon | 349.84 | 0.00 | 369,508.60 | 0.00 |
| Aruba | 268.71 | 0.00 | 372,175.41 | 0.00 |
| Cyprus | 256.26 | 0.00 | 1,861,034.13 | 0.04 |
| The Bahamas | 207.00 | 0.00 | 797,937.00 | 0.01 |
| Saint Vincent and the Grenadines | 174.61 | 0.00 | 122,483.10 | 0.00 |
| Belize | 117.24 | 0.00 | 485,178.85 | 0.01 |
| Cabo Verde | 109.68 | 0.00 | 274,103.95 | 0.00 |
| Montenegro | 108.29 | 0.00 | 777,179.52 | 0.01 |
| Iceland | 30.49 | 0.00 | 1,849,848.39 | 0.04 |
| Montserrat | 30.18 | 0.00 | 13,572.48 | 0.00 |
| Dominica | 15.55 | 0.00 | 87,990.65 | 0.00 |
| Togo | 31,611.17 | 0.00 | ||
| Suriname | 131,279.72 | 0.00 | ||
| Seychelles | 321,381.81 | 0.00 | ||
| São Tomé and Principe | 46,311.37 | 0.00 | ||
| Samoa | 16,599.15 | 0.00 | ||
| Panama | 8,494,809.00 | 0.18 | ||
| Norway | 18,249,345.19 | 0.39 | ||
| Nigeria | 710,414.42 | 0.01 | ||
| Niger | 1,709.27 | 0.00 | ||
| Myanmar | 659,979.03 | 0.01 | ||
| Mauritania | 43,927.39 | 0.00 | ||
| Maldives | 665,512.21 | 0.01 | ||
| Malawi | 80,034.24 | 0.00 | ||
| Gambia | 19,017.36 | 0.00 | ||
| French Polynesia | 727,796.19 | 0.01 | ||
| Ethiopia | 1,838,441.64 | 0.03 | ||
| China, Macao SAR | 19,907.13 | 0.00 | ||
| Burkina Faso | 133,771.77 | 0.00 | ||