Tube/pipe fittings of stainless steel (excl. of 7307.2) | Imports and Exports | 2023
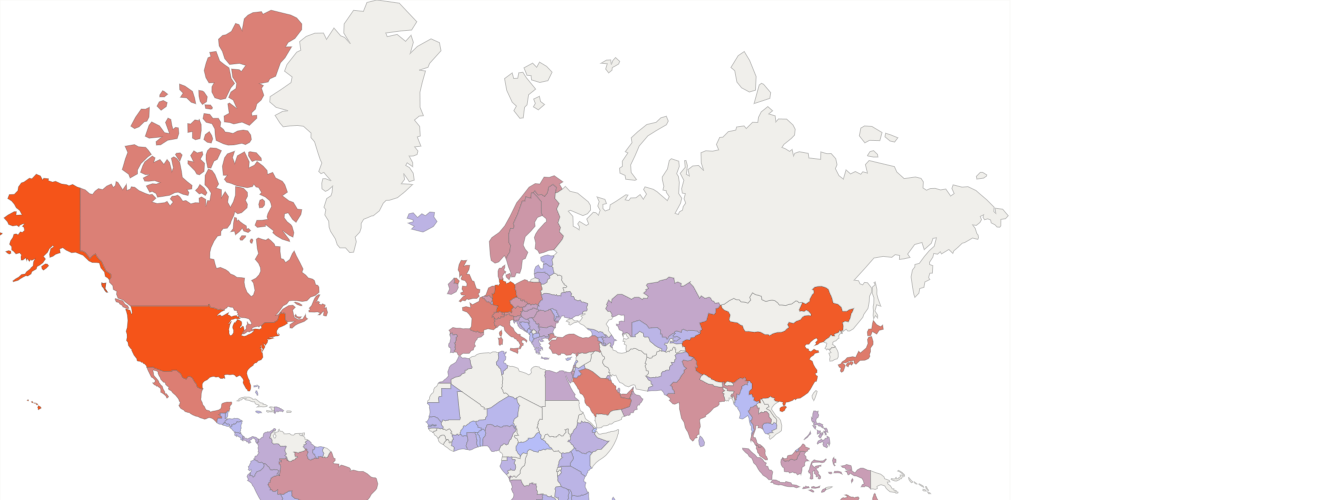
In 2023, the world exports of "Tube/pipe fittings of stainless steel (excl. of 7307.2)" exceeded $2.93 billion (according to external trade statistics of 113 countries). It was $3.11 billion in the previous year (according to merchandise trade statistics of 116 countries).
There are no trade data (2023) for such exporters as Korea (6.19% of the world exports in 2022), Vietnam (2.1%), Angola (0.002%), Benin (0.001%)
Top exporters of Tube/pipe fittings of stainless steel (excl. of 7307.2) in 2023
The world's largest exporters of this commodity group in 2023:
- Germany - 15.3% of the world exports ($450 million)
- USA - 14% ($413 million)
- China - 13.9% ($410 million)
- United Kingdom - 5.63% ($165 million)
- Netherlands - 5.4% ($158 million)
«Tube/pipe fittings of stainless steel (excl. of 7307.2)» accounted for a substantial share of total exports of
- Israel - 0.095% of Israel's total exports in 2023 ($56 million of $59 billion)
- Croatia - 0.075% ($18.6 million of $24 billion)
- Latvia - 0.061% ($12.5 million of $20 billion)
- Denmark - 0.055% ($75 million of $136 billion)
- Kyrgyz Republic - 0.046% ($1.55 million of $3.3 billion)
- Austria - 0.045% ($98 million of $216 billion)
According to statistics provided by the major exporters, the largest flows of exports of «Tube/pipe fittings of stainless steel (excl. of 7307.2)» in 2023:
- Exports from China to USA: (1.73% of the world exports, $50 million according to external trade statistics of China)
- Exports from Germany to Switzerland: (2.06% of the world exports, $60 million according to external trade statistics of Germany)
- Exports from Netherlands to Germany: (1.54% of the world exports, $45 million according to external trade statistics of Netherlands)
- Exports from Other Asia, nes to Japan: (1.72% of the world exports, $50 million according to external trade statistics of Other Asia, nes)
- Exports from Other Asia, nes to USA: (2.57% of the world exports, $75 million according to external trade statistics of Other Asia, nes)
- Exports from Poland to Germany: (1.39% of the world exports, $40 million according to external trade statistics of Poland)
- Exports from USA to Canada: (2.7% of the world exports, $79 million according to external trade statistics of USA)
- Exports from USA to China: (1.36% of the world exports, $40 million according to external trade statistics of USA)
- Exports from USA to Germany: (1.43% of the world exports, $42 million according to external trade statistics of USA)
- Exports from USA to Mexico: (1.92% of the world exports, $56 million according to external trade statistics of USA)
In 2023, the world imports of "Tube/pipe fittings of stainless steel (excl. of 7307.2)" exceeded $3.45 billion (according to external trade statistics of 135 countries). It was $3.52 billion in the previous year (according to merchandise trade statistics of 138 countries).
There are no trade data (2023) for such importers as Korea (2.36% of the world imports in 2022), Vietnam (0.787%), Angola (0.126%), Trinidad and Tobago (0.064%), Cambodia (0.034%), Nepal (0.033%), Mongolia (0.025%), Rwanda (0.013%), State of Palestine (0.005%), Bermuda (0.004%), Lesotho (0.002%), Timor-Leste (0.002%), Burundi (0.001%)
Top importers of Tube/pipe fittings of stainless steel (excl. of 7307.2) in 2023
The world's largest importers of this commodity group in 2023:
- USA - 11.9% of the world imports ($414 million)
- Germany - 10.1% ($350 million)
- China - 10.1% ($350 million)
- Japan - 3.97% ($137 million)
- Saudi Arabia - 3.67% ($127 million)
«Tube/pipe fittings of stainless steel (excl. of 7307.2)» accounted for a substantial share of total imports of
- Guyana - 0.096% of Guyana's total imports in 2023 ($5.02 million of $5.23 billion)
- Saudi Arabia - 0.061% ($127 million of $206 billion)
- Norway - 0.051% ($50 million of $96 billion)
- Slovenia - 0.051% ($31 million of $61 billion)
- Gabon - 0.046% ($1.94 million of $4.21 billion)
According to statistics provided by the major importers, the largest flows of imports of «Tube/pipe fittings of stainless steel (excl. of 7307.2)» in 2023:
- Imports to Austria from Germany (1.38% of the world imports, $47 million according to external trade statistics of Austria)
- Imports to Canada from USA (1.8% of the world imports, $62 million according to external trade statistics of Canada)
- Imports to China from Japan (1.49% of the world imports, $51 million according to external trade statistics of China)
- Imports to China from USA (2.5% of the world imports, $86 million according to external trade statistics of China)
- Imports to Germany from USA (1.47% of the world imports, $51 million according to external trade statistics of Germany)
- Imports to Mexico from USA (1.83% of the world imports, $63 million according to external trade statistics of Mexico)
- Imports to Switzerland from Germany (1.57% of the world imports, $54 million according to external trade statistics of Switzerland)
- Imports to USA from China (1.83% of the world imports, $63 million according to external trade statistics of USA)
- Imports to USA from Korea (1.38% of the world imports, $47 million according to external trade statistics of USA)
- Imports to USA from Other Asia, nes (2.15% of the world imports, $74 million according to external trade statistics of USA)
| Reporter | 730729. Tube/pipe fittings of stainless steel (excl. of 7307.2) | |||
| Exports | Imports | |||
| 2023 | 2023 | |||
| Value (US$) | World Share ($), % | Value (US$) | World Share ($), % | |
| Germany | 450,824,802.32 | 15.35 | 350,679,065.13 | 10.14 |
| USA | 413,039,673.00 | 14.06 | 414,506,308.00 | 11.98 |
| China | 410,410,885.00 | 13.97 | 350,670,601.00 | 10.13 |
| United Kingdom | 165,483,210.24 | 5.63 | 111,601,556.62 | 3.22 |
| Netherlands | 158,542,956.61 | 5.40 | 109,477,329.74 | 3.16 |
| Italy | 128,616,913.16 | 4.38 | 85,178,440.66 | 2.46 |
| Austria | 98,756,399.99 | 3.36 | 67,928,614.20 | 1.96 |
| Japan | 96,421,279.50 | 3.28 | 137,375,354.47 | 3.97 |
| Denmark | 75,815,898.99 | 2.58 | 56,304,606.81 | 1.62 |
| France | 72,890,442.36 | 2.48 | 117,194,927.76 | 3.38 |
| Poland | 68,763,452.00 | 2.34 | 76,124,414.00 | 2.20 |
| Switzerland | 61,420,945.13 | 2.09 | 94,008,913.89 | 2.71 |
| Israel | 56,969,520.00 | 1.94 | 23,404,418.00 | 0.67 |
| India | 51,376,030.97 | 1.74 | 52,715,827.13 | 1.52 |
| Singapore | 47,503,882.23 | 1.61 | 100,585,041.45 | 2.90 |
| United Arab Emirates | 45,008,954.92 | 1.53 | 69,850,343.75 | 2.01 |
| Thailand | 44,212,517.48 | 1.50 | 37,601,510.12 | 1.08 |
| Slovak Republic | 37,992,499.81 | 1.29 | 16,370,642.62 | 0.47 |
| Canada | 34,773,315.33 | 1.18 | 114,126,502.19 | 3.30 |
| Mexico | 34,588,532.00 | 1.17 | 119,611,229.00 | 3.45 |
| Spain | 34,142,787.31 | 1.16 | 44,851,298.79 | 1.29 |
| Czech Republic | 33,345,382.00 | 1.13 | 37,579,006.00 | 1.08 |
| Sweden | 32,018,362.00 | 1.09 | 35,986,633.26 | 1.04 |
| Belgium | 28,022,233.10 | 0.95 | 34,863,369.29 | 1.00 |
| Norway | 26,775,692.38 | 0.91 | 50,101,157.42 | 1.44 |
| Slovenia | 25,574,507.67 | 0.87 | 31,778,311.25 | 0.91 |
| Turkey | 23,447,687.00 | 0.79 | 66,282,336.00 | 1.91 |
| Romania | 18,820,815.55 | 0.64 | 20,010,830.87 | 0.57 |
| Croatia | 18,600,311.00 | 0.63 | 5,304,670.00 | 0.15 |
| Finland | 16,146,699.99 | 0.54 | 37,790,642.10 | 1.09 |
| Hong Kong | 15,450,975.59 | 0.52 | 16,001,188.88 | 0.46 |
| Hungary | 14,840,995.00 | 0.50 | 15,689,863.00 | 0.45 |
| Latvia | 12,562,432.92 | 0.42 | 1,317,628.53 | 0.03 |
| South Africa | 9,849,123.63 | 0.33 | 8,706,415.61 | 0.25 |
| Oman | 8,515,921.96 | 0.29 | 14,763,596.85 | 0.42 |
| Saudi Arabia | 8,040,554.73 | 0.27 | 127,090,619.22 | 3.67 |
| Brazil | 6,996,170.00 | 0.23 | 49,008,639.00 | 1.41 |
| Australia | 5,829,786.13 | 0.19 | 50,007,847.17 | 1.44 |
| Ireland | 5,634,300.47 | 0.19 | 21,793,106.35 | 0.63 |
| New Zealand | 4,499,457.06 | 0.15 | 9,470,479.23 | 0.27 |
| Estonia | 4,155,753.55 | 0.14 | 1,567,464.95 | 0.04 |
| Lithuania | 3,617,279.00 | 0.12 | 3,515,303.00 | 0.10 |
| Serbia | 3,343,927.00 | 0.11 | 4,555,679.00 | 0.13 |
| Luxembourg | 2,842,344.30 | 0.09 | 5,267,395.98 | 0.15 |
| Kazakhstan | 2,152,276.23 | 0.07 | 10,792,201.14 | 0.31 |
| Bulgaria | 1,993,777.46 | 0.06 | 7,524,573.64 | 0.21 |
| Greece | 1,591,730.12 | 0.05 | 4,239,220.67 | 0.12 |
| Kyrgyz Republic | 1,553,898.00 | 0.05 | 1,139,937.00 | 0.03 |
| Malaysia | 1,429,332.60 | 0.04 | 42,697,503.74 | 1.23 |
| Chile | 1,206,652.77 | 0.04 | 9,220,246.83 | 0.26 |
| Tunisia | 1,184,375.47 | 0.04 | 1,644,607.19 | 0.04 |
| Portugal | 1,143,857.85 | 0.03 | 10,386,470.65 | 0.30 |
| Indonesia | 1,012,587.17 | 0.03 | 24,562,861.00 | 0.71 |
| Bosnia and Herzegovina | 926,387.78 | 0.03 | 1,004,875.56 | 0.02 |
| Ukraine | 802,970.79 | 0.02 | 4,442,122.80 | 0.12 |
| Morocco | 735,023.94 | 0.02 | 6,839,779.24 | 0.19 |
| Argentina | 684,829.87 | 0.02 | 4,656,776.76 | 0.13 |
| Philippines | 588,790.00 | 0.02 | 11,126,440.00 | 0.32 |
| Nigeria | 411,765.20 | 0.01 | 4,614,443.97 | 0.13 |
| Azerbaijan | 306,856.27 | 0.01 | 4,228,582.13 | 0.12 |
| Egypt | 220,738.67 | 0.00 | 10,545,563.75 | 0.30 |
| Kuwait | 109,618.18 | 0.00 | 3,806,230.55 | 0.11 |
| Colombia | 108,253.21 | 0.00 | 6,089,618.79 | 0.17 |
| Lebanon | 93,878.00 | 0.00 | 565,024.00 | 0.01 |
| Pakistan | 87,899.21 | 0.00 | 3,541,268.49 | 0.10 |
| Dominican Republic | 81,121.56 | 0.00 | 6,205,608.31 | 0.17 |
| Kenya | 77,772.80 | 0.00 | 654,198.83 | 0.01 |
| Bahrain | 77,158.61 | 0.00 | 2,694,793.45 | 0.07 |
| Armenia | 76,973.28 | 0.00 | 591,962.48 | 0.01 |
| Guatemala | 71,035.00 | 0.00 | 1,333,355.00 | 0.03 |
| El Salvador | 55,069.00 | 0.00 | 488,753.10 | 0.01 |
| North Macedonia | 53,818.50 | 0.00 | 580,382.16 | 0.01 |
| Tanzania | 52,349.86 | 0.00 | 1,799,556.42 | 0.05 |
| Peru | 47,718.35 | 0.00 | 4,410,837.15 | 0.12 |
| Sri Lanka | 43,222.46 | 0.00 | 3,123,616.09 | 0.09 |
| Guyana | 40,969.23 | 0.00 | 5,020,870.82 | 0.14 |
| Zambia | 39,029.32 | 0.00 | 1,293,561.89 | 0.03 |
| Brunei | 30,275.05 | 0.00 | 1,100,458.96 | 0.03 |
| Montenegro | 30,135.87 | 0.00 | 243,151.50 | 0.00 |
| Gabon | 23,306.96 | 0.00 | 1,949,742.00 | 0.05 |
| Fiji | 18,257.65 | 0.00 | 458,570.96 | 0.01 |
| Moldova | 18,196.00 | 0.00 | 913,906.00 | 0.02 |
| Namibia | 18,148.14 | 0.00 | 1,528,021.94 | 0.04 |
| Andorra | 17,492.69 | 0.00 | 290,720.84 | 0.00 |
| Senegal | 16,472.01 | 0.00 | 1,164,173.78 | 0.03 |
| Ecuador | 15,828.50 | 0.00 | 2,068,564.10 | 0.05 |
| Ghana | 15,816.81 | 0.00 | 3,247,990.70 | 0.09 |
| Jamaica | 15,799.72 | 0.00 | 1,077,072.18 | 0.03 |
| Georgia | 12,376.56 | 0.00 | 1,067,900.74 | 0.03 |
| Uruguay | 9,675.00 | 0.00 | 642,772.32 | 0.01 |
| The Bahamas | 9,428.00 | 0.00 | 1,133,367.00 | 0.03 |
| Malta | 9,182.13 | 0.00 | 409,432.09 | 0.01 |
| Jordan | 9,078.80 | 0.00 | 727,619.09 | 0.02 |
| Iceland | 8,859.33 | 0.00 | 1,963,306.68 | 0.05 |
| Mauritius | 8,754.36 | 0.00 | 733,000.76 | 0.02 |
| Mauritania | 8,288.41 | 0.00 | 1,053,570.29 | 0.03 |
| Uzbekistan | 6,506.00 | 0.00 | 1,494,157.82 | 0.04 |
| Zimbabwe | 6,415.96 | 0.00 | 688,856.71 | 0.01 |
| Botswana | 6,400.46 | 0.00 | 981,155.14 | 0.02 |
| Nicaragua | 6,376.50 | 0.00 | 512,708.80 | 0.01 |
| Costa Rica | 6,251.04 | 0.00 | 1,512,495.38 | 0.04 |
| Mozambique | 6,000.00 | 0.00 | 1,057,000.00 | 0.03 |
| Cyprus | 5,744.78 | 0.00 | 418,758.03 | 0.01 |
| Cabo Verde | 5,563.58 | 0.00 | 75,704.54 | 0.00 |
| Côte d`Ivoire | 5,558.97 | 0.00 | 1,509,167.55 | 0.04 |
| Togo | 1,815.75 | 0.00 | 283,726.51 | 0.00 |
| Madagascar | 1,350.42 | 0.00 | 1,001,559.53 | 0.02 |
| Swaziland | 578.55 | 0.00 | 466,100.00 | 0.01 |
| Ethiopia | 472.13 | 0.00 | 2,928,664.25 | 0.08 |
| Dominica | 338.51 | 0.00 | 67,053.26 | 0.00 |
| Bolivia | 66.45 | 0.00 | 1,109,189.00 | 0.03 |
| Belize | 42.16 | 0.00 | 327,742.24 | 0.00 |
| Antigua and Barbuda | 20.11 | 0.00 | 57,553.11 | 0.00 |
| Suriname | 599,887.84 | 0.01 | ||
| Seychelles | 256,868.62 | 0.00 | ||
| São Tomé and Principe | 5,661.97 | 0.00 | ||
| Samoa | 81,923.71 | 0.00 | ||
| Saint Vincent and the Grenadines | 52,352.76 | 0.00 | ||
| Qatar | 11,698,875.08 | 0.33 | ||
| Paraguay | 310,861.54 | 0.00 | ||
| Panama | 4,969,353.00 | 0.14 | ||
| Niger | 766,171.60 | 0.02 | ||
| Myanmar | 236,740.49 | 0.00 | ||
| Montserrat | 15,390.70 | 0.00 | ||
| Maldives | 534,374.47 | 0.01 | ||
| Malawi | 719,250.93 | 0.02 | ||
| Gambia | 2,802.35 | 0.00 | ||
| French Polynesia | 136,406.60 | 0.00 | ||
| Djibouti | 462.92 | 0.00 | ||
| China, Macao SAR | 205,982.95 | 0.00 | ||
| Central African Republic | 68,694.51 | 0.00 | ||
| Burkina Faso | 101,092.25 | 0.00 | ||
| Benin | 273,089.27 | 0.00 | ||
| Barbados | 301,679.00 | 0.00 | ||
| Aruba | 265,882.11 | 0.00 | ||