Electric accumulators, incl. separators therefor, whether or not rect. (incl. square), nickel-cadmium | Imports and Exports | 2023
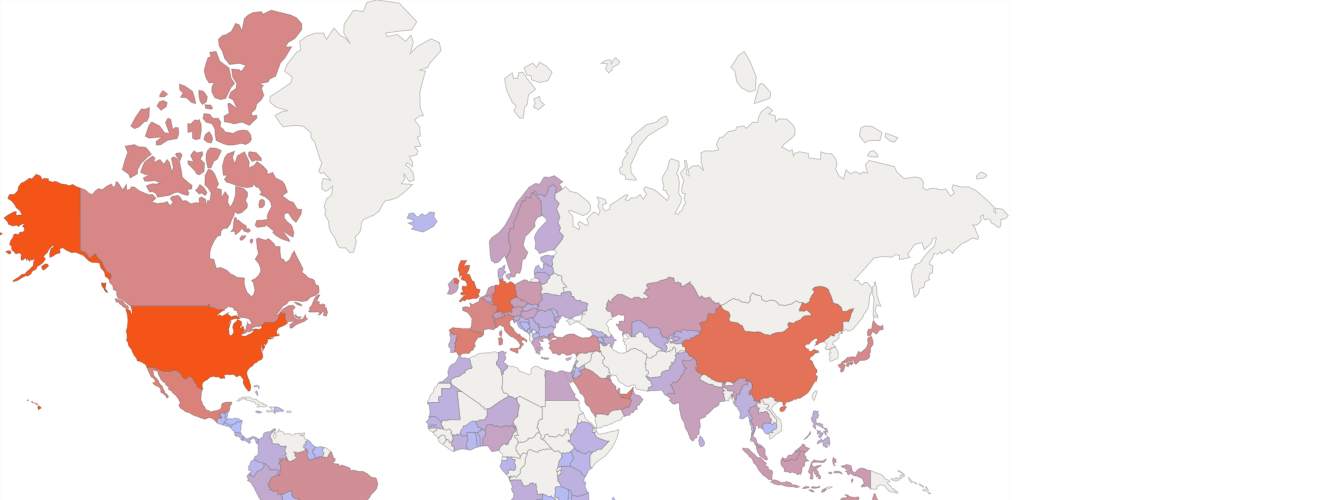
In 2023, the world imports of "Electric accumulators, incl. separators therefor, whether or not rect. (incl. square), nickel-cadmium" exceeded $730 million (according to external trade statistics of 135 countries). It was $672 million in the previous year (according to merchandise trade statistics of 138 countries).
There are no trade data (2023) for such importers as Korea (2.7% of the world imports in 2022), Vietnam (0.671%), Trinidad and Tobago (0.029%), Mongolia (0.021%), Albania (0.013%), Rwanda (0.012%), State of Palestine (0.01%), Nepal (0.001%), Burundi (0.001%)
Top importers of Electric accumulators, incl. separators therefor, whether or not rect. (incl. square), nickel-cadmium in 2023
The world's largest importers of this commodity group in 2023:
- USA - 13.2% of the world imports ($96 million)
- United Kingdom - 9.09% ($66 million)
- Germany - 8.01% ($58 million)
- Singapore - 6.15% ($44 million)
- China - 5.92% ($43 million)
«Electric accumulators, incl. separators therefor, whether or not rect. (incl. square), nickel-cadmium» accounted for a substantial share of total imports of
- Niger - 0.043% of Niger's total imports in 2023 ($1.37 million of $3.14 billion)
- Kuwait - 0.027% ($10.2 million of $37 billion)
- Qatar - 0.022% ($7.14 million of $31 billion)
- Andorra - 0.018% ($365 thousand of $1.99 billion)
- Mauritania - 0.013% ($647 thousand of $4.81 billion)
- Bahrain - 0.012% ($1.93 million of $15.3 billion)
- Benin - 0.011% ($435 thousand of $3.9 billion)
- Singapore - 0.01% ($44 million of $422 billion)
According to statistics provided by the major importers, the largest flows of imports of «Electric accumulators, incl. separators therefor, whether or not rect. (incl. square), nickel-cadmium» in 2023:
- Imports to China from USA (2.74% of the world imports, $20 million according to external trade statistics of China)
- Imports to Germany from France (2.45% of the world imports, $17.9 million according to external trade statistics of Germany)
- Imports to Germany from USA (2.91% of the world imports, $21 million according to external trade statistics of Germany)
- Imports to Hong Kong from China (3.39% of the world imports, $24 million according to external trade statistics of Hong Kong)
- Imports to Mexico from China (2.07% of the world imports, $15.1 million according to external trade statistics of Mexico)
- Imports to Singapore from France (2.36% of the world imports, $17.2 million according to external trade statistics of Singapore)
- Imports to United Kingdom from France (2.81% of the world imports, $20 million according to external trade statistics of United Kingdom)
- Imports to United Kingdom from USA (3.89% of the world imports, $28 million according to external trade statistics of United Kingdom)
- Imports to USA from France (4.91% of the world imports, $35 million according to external trade statistics of USA)
- Imports to USA from Germany (2.43% of the world imports, $17.8 million according to external trade statistics of USA)
In 2023, the world exports of "Electric accumulators, incl. separators therefor, whether or not rect. (incl. square), nickel-cadmium" exceeded $809 million (according to external trade statistics of 90 countries). It was $699 million in the previous year (according to merchandise trade statistics of 85 countries).
Top exporters of Electric accumulators, incl. separators therefor, whether or not rect. (incl. square), nickel-cadmium in 2023
The world's largest exporters of this commodity group in 2023:
- USA - 18.6% of the world exports ($150 million)
- France - 15.3% ($124 million)
- Sweden - 15.1% ($122 million)
- Germany - 14% ($113 million)
- China - 8.03% ($65 million)
«Electric accumulators, incl. separators therefor, whether or not rect. (incl. square), nickel-cadmium» accounted for a substantial share of total exports of
- Sweden - 0.061% of Sweden's total exports in 2023 ($122 million of $197 billion)
- France - 0.019% ($124 million of $640 billion)
- Ukraine - 0.012% ($4.36 million of $36 billion)
According to statistics provided by the major exporters, the largest flows of exports of «Electric accumulators, incl. separators therefor, whether or not rect. (incl. square), nickel-cadmium» in 2023:
- Exports from France to United Kingdom: (3.11% of the world exports, $25 million according to external trade statistics of France)
- Exports from France to USA: (3.58% of the world exports, $29 million according to external trade statistics of France)
- Exports from Germany to USA: (2.12% of the world exports, $17.1 million according to external trade statistics of Germany)
- Exports from Sweden to United Arab Emirates: (1.77% of the world exports, $14.4 million according to external trade statistics of Sweden)
- Exports from Sweden to USA: (1.86% of the world exports, $15.1 million according to external trade statistics of Sweden)
- Exports from USA to Canada: (1.94% of the world exports, $15.7 million according to external trade statistics of USA)
- Exports from USA to Germany: (1.86% of the world exports, $15 million according to external trade statistics of USA)
- Exports from USA to Mexico: (2.56% of the world exports, $20 million according to external trade statistics of USA)
- Exports from USA to Singapore: (1.67% of the world exports, $13.5 million according to external trade statistics of USA)
- Exports from USA to United Kingdom: (1.98% of the world exports, $16 million according to external trade statistics of USA)
| Reporter | 850730. Electric accumulators, incl. separators therefor, whether or not rect. (incl. square), nickel-cadmium | |||
| Exports | Imports | |||
| 2023 | 2023 | |||
| Value (US$) | World Share ($), % | Value (US$) | World Share ($), % | |
| USA | 150,641,241.00 | 18.61 | 96,944,012.00 | 13.26 |
| France | 124,443,427.13 | 15.37 | 19,081,371.16 | 2.61 |
| Sweden | 122,573,343.36 | 15.14 | 5,869,656.03 | 0.80 |
| Germany | 113,573,491.00 | 14.03 | 58,559,194.54 | 8.01 |
| China | 65,011,351.00 | 8.03 | 43,277,611.00 | 5.92 |
| United Kingdom | 34,290,460.75 | 4.23 | 66,470,829.65 | 9.09 |
| Hong Kong | 31,762,049.78 | 3.92 | 35,964,319.52 | 4.92 |
| India | 27,016,976.53 | 3.33 | 4,669,424.78 | 0.63 |
| Singapore | 26,456,451.42 | 3.26 | 44,964,248.99 | 6.15 |
| Czech Republic | 18,315,019.00 | 2.26 | 4,812,039.00 | 0.65 |
| Italy | 12,688,261.23 | 1.56 | 23,879,533.09 | 3.26 |
| Netherlands | 9,520,020.91 | 1.17 | 8,521,445.55 | 1.16 |
| United Arab Emirates | 8,751,421.21 | 1.08 | 28,484,132.30 | 3.89 |
| Spain | 7,731,734.01 | 0.95 | 28,341,728.51 | 3.87 |
| Japan | 6,335,795.81 | 0.78 | 17,695,633.34 | 2.42 |
| Mexico | 4,915,966.00 | 0.60 | 24,574,080.00 | 3.36 |
| Ukraine | 4,367,599.22 | 0.53 | 1,653,019.53 | 0.22 |
| Canada | 4,296,772.24 | 0.53 | 19,919,425.72 | 2.72 |
| Norway | 3,803,811.58 | 0.47 | 3,984,621.34 | 0.54 |
| Ireland | 3,124,005.62 | 0.38 | 4,511,067.82 | 0.61 |
| Turkey | 2,735,863.00 | 0.33 | 13,408,908.00 | 1.83 |
| Brazil | 2,441,655.00 | 0.30 | 13,889,776.00 | 1.90 |
| Switzerland | 2,367,947.89 | 0.29 | 6,950,463.52 | 0.95 |
| Poland | 2,023,801.00 | 0.25 | 6,958,945.00 | 0.95 |
| Kazakhstan | 1,970,031.01 | 0.24 | 6,460,588.90 | 0.88 |
| Hungary | 1,928,821.00 | 0.23 | 3,247,422.00 | 0.44 |
| Denmark | 1,826,972.39 | 0.22 | 1,460,429.59 | 0.19 |
| Austria | 1,749,491.54 | 0.21 | 5,057,233.90 | 0.69 |
| Lithuania | 1,569,510.00 | 0.19 | 1,497,962.00 | 0.20 |
| Malaysia | 1,394,532.32 | 0.17 | 7,157,039.45 | 0.97 |
| Slovenia | 1,341,614.72 | 0.16 | 1,630,513.50 | 0.22 |
| Colombia | 1,054,100.47 | 0.13 | 1,008,879.84 | 0.13 |
| Tunisia | 1,030,393.19 | 0.12 | 1,381,884.10 | 0.18 |
| Australia | 774,350.19 | 0.09 | 11,017,432.17 | 1.50 |
| South Africa | 702,584.41 | 0.08 | 4,537,847.64 | 0.62 |
| Estonia | 521,719.01 | 0.06 | 962,045.02 | 0.13 |
| Israel | 453,021.00 | 0.05 | 1,731,028.00 | 0.23 |
| Romania | 449,210.91 | 0.05 | 887,976.32 | 0.12 |
| Finland | 399,168.69 | 0.04 | 1,506,149.88 | 0.20 |
| Latvia | 383,650.32 | 0.04 | 674,656.47 | 0.09 |
| Thailand | 358,396.40 | 0.04 | 4,807,285.38 | 0.65 |
| Belgium | 328,859.02 | 0.04 | 2,426,421.48 | 0.33 |
| Portugal | 279,798.80 | 0.03 | 1,391,684.62 | 0.19 |
| Greece | 178,748.84 | 0.02 | 3,772,183.99 | 0.51 |
| Lebanon | 175,548.00 | 0.02 | 45,594.00 | 0.00 |
| Bulgaria | 157,275.97 | 0.01 | 415,531.14 | 0.05 |
| Jordan | 152,598.97 | 0.01 | 287,886.09 | 0.03 |
| Kyrgyz Republic | 147,810.00 | 0.01 | 868,078.00 | 0.11 |
| Serbia | 144,393.00 | 0.01 | 575,934.00 | 0.07 |
| Saudi Arabia | 79,052.53 | 0.00 | 14,479,573.23 | 1.98 |
| Ecuador | 71,787.10 | 0.00 | 249,276.70 | 0.03 |
| Indonesia | 58,967.09 | 0.00 | 7,074,200.00 | 0.96 |
| Croatia | 57,624.00 | 0.00 | 443,675.00 | 0.06 |
| Malta | 48,930.64 | 0.00 | 343,594.72 | 0.04 |
| Morocco | 43,173.68 | 0.00 | 1,093,776.92 | 0.14 |
| Côte d`Ivoire | 33,955.10 | 0.00 | 921,146.04 | 0.12 |
| Philippines | 27,268.00 | 0.00 | 1,498,080.00 | 0.20 |
| Costa Rica | 26,855.17 | 0.00 | 403,543.12 | 0.05 |
| New Zealand | 25,290.68 | 0.00 | 2,475,407.58 | 0.33 |
| Georgia | 17,064.72 | 0.00 | 238,327.78 | 0.03 |
| Armenia | 13,575.72 | 0.00 | 148,941.54 | 0.02 |
| Seychelles | 11,239.89 | 0.00 | 72,831.77 | 0.00 |
| Brunei | 11,043.38 | 0.00 | 563,548.12 | 0.07 |
| Oman | 11,014.30 | 0.00 | 3,506,590.37 | 0.47 |
| Kuwait | 9,495.92 | 0.00 | 10,231,901.52 | 1.40 |
| Sri Lanka | 8,078.30 | 0.00 | 867,144.04 | 0.11 |
| Luxembourg | 7,775.83 | 0.00 | 427,098.34 | 0.05 |
| Slovak Republic | 7,046.62 | 0.00 | 1,018,365.81 | 0.13 |
| Gabon | 6,696.89 | 0.00 | 288,848.20 | 0.03 |
| Namibia | 5,835.58 | 0.00 | 241,123.75 | 0.03 |
| Chile | 5,423.62 | 0.00 | 1,820,062.02 | 0.24 |
| Uganda | 5,102.05 | 0.00 | 95,632.60 | 0.01 |
| Azerbaijan | 4,912.70 | 0.00 | 1,369,650.64 | 0.18 |
| Djibouti | 4,865.83 | 0.00 | ||
| Guyana | 4,849.99 | 0.00 | 146,256.04 | 0.02 |
| Andorra | 4,237.82 | 0.00 | 365,867.75 | 0.05 |
| Angola | 1,952.80 | 0.00 | 1,045,060.44 | 0.14 |
| Moldova | 1,546.00 | 0.00 | 157,236.00 | 0.02 |
| Uzbekistan | 1,216.00 | 0.00 | 757,867.00 | 0.10 |
| Bahrain | 975.21 | 0.00 | 1,932,045.42 | 0.26 |
| Kenya | 626.62 | 0.00 | 313,649.10 | 0.04 |
| Egypt | 580.00 | 0.00 | 2,959,809.95 | 0.40 |
| Peru | 557.70 | 0.00 | 2,013,324.74 | 0.27 |
| Montenegro | 540.71 | 0.00 | 35,865.41 | 0.00 |
| Senegal | 425.84 | 0.00 | 519,045.25 | 0.07 |
| Bosnia and Herzegovina | 345.93 | 0.00 | 37,116.44 | 0.00 |
| Pakistan | 306.46 | 0.00 | 1,216,929.66 | 0.16 |
| The Bahamas | 195.00 | 0.00 | 212,231.00 | 0.02 |
| North Macedonia | 70.88 | 0.00 | 51,915.58 | 0.00 |
| Guatemala | 59.00 | 0.00 | 79,059.00 | 0.01 |
| Zimbabwe | 99,158.64 | 0.01 | ||
| Zambia | 43,815.94 | 0.00 | ||
| Uruguay | 34,767.73 | 0.00 | ||
| Togo | 44,609.73 | 0.00 | ||
| Tanzania | 656,464.27 | 0.08 | ||
| Swaziland | 4,433.45 | 0.00 | ||
| Suriname | 32,710.68 | 0.00 | ||
| São Tomé and Principe | 934.23 | 0.00 | ||
| Saint Vincent and the Grenadines | 140.16 | 0.00 | ||
| Qatar | 7,148,914.08 | 0.97 | ||
| Paraguay | 93,652.97 | 0.01 | ||
| Panama | 827,230.00 | 0.11 | ||
| Nigeria | 3,303,115.16 | 0.45 | ||
| Niger | 1,370,509.06 | 0.18 | ||
| Nicaragua | 4,882.75 | 0.00 | ||
| Myanmar | 737,197.17 | 0.10 | ||
| Mozambique | 468,000.00 | 0.06 | ||
| Montserrat | 344.10 | 0.00 | ||
| Mauritius | 234,890.10 | 0.03 | ||
| Mauritania | 647,084.40 | 0.08 | ||
| Maldives | 28,495.25 | 0.00 | ||
| Malawi | 52,166.43 | 0.00 | ||
| Madagascar | 4,743.40 | 0.00 | ||
| Lesotho | 5,667.37 | 0.00 | ||
| Jamaica | 247,969.57 | 0.03 | ||
| Iceland | 142,253.74 | 0.01 | ||
| Honduras | 3,987.03 | 0.00 | ||
| Ghana | 114,977.91 | 0.01 | ||
| French Polynesia | 50,611.33 | 0.00 | ||
| Fiji | 6,775.17 | 0.00 | ||
| Ethiopia | 475,602.63 | 0.06 | ||
| El Salvador | 37,628.85 | 0.00 | ||
| Dominican Republic | 85,462.77 | 0.01 | ||
| Dominica | 1,250.36 | 0.00 | ||
| Cyprus | 169,069.32 | 0.02 | ||
| China, Macao SAR | 590,028.59 | 0.08 | ||
| Cambodia | 38,596.66 | 0.00 | ||
| Cabo Verde | 432.46 | 0.00 | ||
| Burkina Faso | 147,980.40 | 0.02 | ||
| Botswana | 59,737.17 | 0.00 | ||
| Bolivia | 85,218.00 | 0.01 | ||
| Benin | 435,680.88 | 0.05 | ||
| Belize | 1,477.51 | 0.00 | ||
| Barbados | 16,513.50 | 0.00 | ||
| Aruba | 10,420.67 | 0.00 | ||
| Argentina | 2,356,331.41 | 0.32 | ||