Electric accumulators; nickel-metal hydride, including separators, whether or not rectangular (including square) | Imports and Exports | 2023
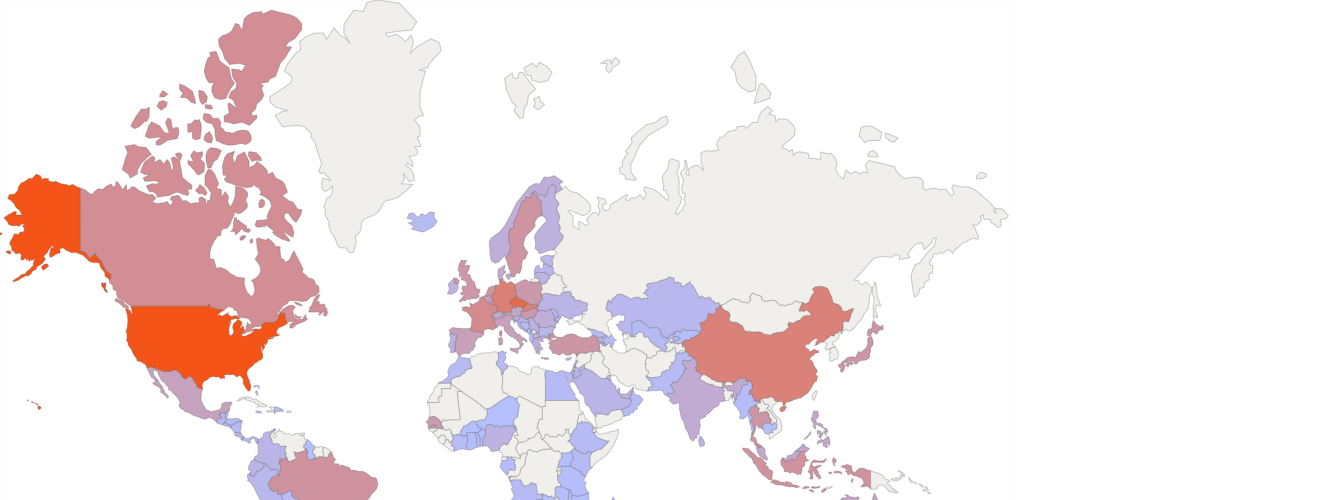
In 2023, the world exports of "Electric accumulators; nickel-metal hydride, including separators, whether or not rectangular (including square)" exceeded $1.94 billion (according to external trade statistics of 79 countries). It was $2.1 billion in the previous year (according to merchandise trade statistics of 81 countries).
There are no trade data (2023) for such exporters as Korea (0.008% of the world exports in 2022), Vietnam (0.002%)
Top exporters of Electric accumulators; nickel-metal hydride, including separators, whether or not rectangular (including square) in 2023
The world's largest exporters of this commodity group in 2023:
- Japan - 53% of the world exports ($1.04 billion)
- China - 18% ($349 million)
- Hong Kong - 5.73% ($111 million)
- Germany - 5.4% ($104 million)
- France - 3.2% ($62 million)
«Electric accumulators; nickel-metal hydride, including separators, whether or not rectangular (including square)» accounted for a substantial share of total exports of
- Japan - 0.145% of Japan's total exports in 2023 ($1.04 billion of $717 billion)
- Hong Kong - 0.019% ($111 million of $575 billion)
According to statistics provided by the major exporters, the largest flows of exports of «Electric accumulators; nickel-metal hydride, including separators, whether or not rectangular (including square)» in 2023:
- Exports from China to Germany: (1.8% of the world exports, $35 million according to external trade statistics of China)
- Exports from China to Hong Kong: (2.86% of the world exports, $55 million according to external trade statistics of China)
- Exports from China to USA: (3.09% of the world exports, $60 million according to external trade statistics of China)
- Exports from Japan to Brazil: (2% of the world exports, $38 million according to external trade statistics of Japan)
- Exports from Japan to Canada: (8.46% of the world exports, $164 million according to external trade statistics of Japan)
- Exports from Japan to China: (4% of the world exports, $77 million according to external trade statistics of Japan)
- Exports from Japan to India: (2.93% of the world exports, $57 million according to external trade statistics of Japan)
- Exports from Japan to Indonesia: (1.69% of the world exports, $32 million according to external trade statistics of Japan)
- Exports from Japan to Thailand: (1.65% of the world exports, $32 million according to external trade statistics of Japan)
- Exports from Japan to USA: (24% of the world exports, $474 million according to external trade statistics of Japan)
In 2023, the world imports of "Electric accumulators; nickel-metal hydride, including separators, whether or not rectangular (including square)" exceeded $1.83 billion (according to external trade statistics of 133 countries). It was $2.09 billion in the previous year (according to merchandise trade statistics of 133 countries).
Top importers of Electric accumulators; nickel-metal hydride, including separators, whether or not rectangular (including square) in 2023
The world's largest importers of this commodity group in 2023:
- USA - 21% of the world imports ($400 million)
- Czech Republic - 12% ($222 million)
- Hong Kong - 7.37% ($135 million)
- Germany - 5.88% ($108 million)
- China - 5.61% ($103 million)
«Electric accumulators; nickel-metal hydride, including separators, whether or not rectangular (including square)» accounted for a substantial share of total imports of
- Senegal - 0.226% of Senegal's total imports in 2023 ($26 million of $11.8 billion)
- Czech Republic - 0.097% ($222 million of $228 billion)
- Slovak Republic - 0.085% ($98 million of $115 billion)
- Belize - 0.031% ($418 thousand of $1.33 billion)
- North Macedonia - 0.025% ($3.01 million of $12 billion)
- Hungary - 0.021% ($32 million of $148 billion)
- Sweden - 0.021% ($42 million of $193 billion)
- Indonesia - 0.021% ($47 million of $221 billion)
- Hong Kong - 0.02% ($135 million of $654 billion)
According to statistics provided by the major importers, the largest flows of imports of «Electric accumulators; nickel-metal hydride, including separators, whether or not rectangular (including square)» in 2023:
- Imports to Canada from Japan (2.64% of the world imports, $48 million according to external trade statistics of Canada)
- Imports to China from Japan (4.84% of the world imports, $88 million according to external trade statistics of China)
- Imports to Czech Republic from Hungary (7.49% of the world imports, $137 million according to external trade statistics of Czech Republic)
- Imports to Czech Republic from Korea (3.2% of the world imports, $58 million according to external trade statistics of Czech Republic)
- Imports to Germany from China (2.87% of the world imports, $52 million according to external trade statistics of Germany)
- Imports to Hong Kong from China (6.98% of the world imports, $128 million according to external trade statistics of Hong Kong)
- Imports to Indonesia from Japan (2.39% of the world imports, $43 million according to external trade statistics of Indonesia)
- Imports to Slovak Republic from Hungary (5.17% of the world imports, $95 million according to external trade statistics of Slovak Republic)
- Imports to USA from China (2.13% of the world imports, $39 million according to external trade statistics of USA)
- Imports to USA from Japan (17.8% of the world imports, $327 million according to external trade statistics of USA)
| Reporter | 850750. Electric accumulators; nickel-metal hydride, including separators, whether or not rectangular (including square) | |||
| Exports | Imports | |||
| 2023 | 2023 | |||
| Value (US$) | World Share ($), % | Value (US$) | World Share ($), % | |
| Japan | 1,041,278,551.56 | 53.67 | 36,987,942.41 | 2.01 |
| China | 349,702,628.00 | 18.02 | 103,047,119.00 | 5.61 |
| Hong Kong | 111,332,254.04 | 5.73 | 135,412,917.22 | 7.37 |
| Germany | 104,875,050.42 | 5.40 | 108,006,676.83 | 5.88 |
| France | 62,245,376.59 | 3.20 | 67,504,090.84 | 3.67 |
| Netherlands | 50,712,925.55 | 2.61 | 43,159,399.22 | 2.35 |
| Poland | 35,803,538.00 | 1.84 | 31,197,285.00 | 1.69 |
| USA | 27,495,768.00 | 1.41 | 400,527,696.00 | 21.80 |
| Belgium | 27,410,500.99 | 1.41 | 19,324,906.61 | 1.05 |
| Sweden | 25,023,652.43 | 1.28 | 42,089,744.74 | 2.29 |
| Singapore | 17,746,120.47 | 0.91 | 19,888,523.40 | 1.08 |
| United Kingdom | 16,247,810.76 | 0.83 | 36,250,005.49 | 1.97 |
| Hungary | 11,994,246.00 | 0.61 | 32,521,528.00 | 1.77 |
| Malaysia | 11,766,761.47 | 0.60 | 9,856,455.60 | 0.53 |
| Austria | 7,002,987.59 | 0.36 | 11,033,749.40 | 0.60 |
| Czech Republic | 6,799,968.00 | 0.35 | 222,095,978.00 | 12.09 |
| Italy | 5,691,347.12 | 0.29 | 18,978,190.02 | 1.03 |
| Denmark | 3,015,115.07 | 0.15 | 6,966,745.85 | 0.37 |
| Spain | 2,827,524.50 | 0.14 | 19,765,083.90 | 1.07 |
| Mexico | 2,501,278.00 | 0.12 | 16,794,218.00 | 0.91 |
| Switzerland | 2,021,130.86 | 0.10 | 7,805,828.64 | 0.42 |
| Romania | 1,725,490.52 | 0.08 | 4,489,138.23 | 0.24 |
| United Arab Emirates | 1,507,627.79 | 0.07 | 3,629,760.36 | 0.19 |
| Norway | 1,461,997.50 | 0.07 | 4,308,745.86 | 0.23 |
| Canada | 1,405,714.38 | 0.07 | 58,483,195.33 | 3.18 |
| Israel | 1,281,002.00 | 0.06 | 1,431,131.00 | 0.07 |
| Costa Rica | 1,173,150.54 | 0.06 | 445,271.12 | 0.02 |
| Finland | 982,274.15 | 0.05 | 2,823,420.51 | 0.15 |
| Portugal | 775,796.17 | 0.03 | 2,426,411.11 | 0.13 |
| Greece | 596,250.44 | 0.03 | 4,359,167.96 | 0.23 |
| Slovak Republic | 592,067.01 | 0.03 | 98,080,508.71 | 5.34 |
| Bahrain | 568,142.10 | 0.02 | 125,587.69 | 0.00 |
| Australia | 418,443.88 | 0.02 | 13,390,230.58 | 0.72 |
| Latvia | 381,901.91 | 0.01 | 702,689.44 | 0.03 |
| Chile | 359,780.99 | 0.01 | 1,139,858.13 | 0.06 |
| Ireland | 349,214.08 | 0.01 | 2,551,716.09 | 0.13 |
| Bulgaria | 335,924.92 | 0.01 | 1,138,354.30 | 0.06 |
| Indonesia | 309,672.53 | 0.01 | 47,117,776.00 | 2.56 |
| Lithuania | 306,807.00 | 0.01 | 1,545,508.00 | 0.08 |
| India | 281,839.97 | 0.01 | 6,512,805.35 | 0.35 |
| Turkey | 264,451.00 | 0.01 | 37,972,015.00 | 2.06 |
| Estonia | 189,529.95 | 0.00 | 815,974.49 | 0.04 |
| Brazil | 138,811.00 | 0.00 | 44,538,239.00 | 2.42 |
| South Africa | 138,526.78 | 0.00 | 2,773,043.08 | 0.15 |
| Tunisia | 115,623.96 | 0.00 | 318,014.82 | 0.01 |
| Slovenia | 104,418.96 | 0.00 | 1,363,681.54 | 0.07 |
| Serbia | 97,420.00 | 0.00 | 2,178,125.00 | 0.11 |
| New Zealand | 96,513.71 | 0.00 | 2,784,276.64 | 0.15 |
| Croatia | 90,641.00 | 0.00 | 836,546.00 | 0.04 |
| Kazakhstan | 87,686.55 | 0.00 | 577,872.23 | 0.03 |
| Malta | 81,500.62 | 0.00 | 295,313.92 | 0.01 |
| Georgia | 62,977.30 | 0.00 | 106,307.22 | 0.00 |
| Armenia | 48,518.98 | 0.00 | 119,095.85 | 0.00 |
| Luxembourg | 47,068.11 | 0.00 | 513,702.93 | 0.02 |
| Ukraine | 37,289.96 | 0.00 | 1,507,202.84 | 0.08 |
| Thailand | 31,436.17 | 0.00 | 37,135,328.02 | 2.02 |
| Andorra | 21,724.85 | 0.00 | 3,344.38 | 0.00 |
| Kenya | 7,091.84 | 0.00 | 145,864.55 | 0.00 |
| Guyana | 5,159.99 | 0.00 | 5,810.65 | 0.00 |
| Bosnia and Herzegovina | 4,659.85 | 0.00 | 269,926.04 | 0.01 |
| Saudi Arabia | 4,275.46 | 0.00 | 1,353,713.83 | 0.07 |
| Sri Lanka | 3,679.68 | 0.00 | 1,723,821.90 | 0.09 |
| Iceland | 3,514.82 | 0.00 | 197,212.51 | 0.01 |
| Jordan | 2,746.47 | 0.00 | 1,496,649.06 | 0.08 |
| Azerbaijan | 2,349.84 | 0.00 | 305,605.12 | 0.01 |
| Colombia | 1,531.12 | 0.00 | 1,557,602.53 | 0.08 |
| Côte d`Ivoire | 1,455.52 | 0.00 | 54,583.18 | 0.00 |
| Montenegro | 799.09 | 0.00 | 44,603.58 | 0.00 |
| Morocco | 757.14 | 0.00 | 188,823.20 | 0.01 |
| Guatemala | 549.00 | 0.00 | 238,100.00 | 0.01 |
| Ecuador | 363.40 | 0.00 | 1,370,756.30 | 0.07 |
| Peru | 338.55 | 0.00 | 673,843.82 | 0.03 |
| Ghana | 289.70 | 0.00 | 15,824.14 | 0.00 |
| Kuwait | 188.81 | 0.00 | 554,633.21 | 0.03 |
| Moldova | 103.00 | 0.00 | 174,451.00 | 0.00 |
| Angola | 47.34 | 0.00 | 142,351.65 | 0.00 |
| Lebanon | 34.00 | 0.00 | 80,586.00 | 0.00 |
| El Salvador | 13.00 | 0.00 | 152,130.97 | 0.00 |
| North Macedonia | 4.45 | 0.00 | 3,018,437.94 | 0.16 |
| Zimbabwe | 64,519.79 | 0.00 | ||
| Zambia | 45,001.63 | 0.00 | ||
| Uzbekistan | 163,001.98 | 0.00 | ||
| Uruguay | 161,655.16 | 0.00 | ||
| Uganda | 8,130.81 | 0.00 | ||
| Togo | 18,385.67 | 0.00 | ||
| The Bahamas | 54,118.00 | 0.00 | ||
| Tanzania | 20,785.41 | 0.00 | ||
| Swaziland | 777.93 | 0.00 | ||
| Seychelles | 3,033.91 | 0.00 | ||
| Senegal | 26,883,502.49 | 1.46 | ||
| Samoa | 66.79 | 0.00 | ||
| Saint Vincent and the Grenadines | 664.78 | 0.00 | ||
| Qatar | 357,294.28 | 0.01 | ||
| Philippines | 10,554,131.00 | 0.57 | ||
| Paraguay | 254,373.66 | 0.01 | ||
| Panama | 138,849.00 | 0.00 | ||
| Pakistan | 207,301.27 | 0.01 | ||
| Oman | 209,453.83 | 0.01 | ||
| Nigeria | 2,188,373.22 | 0.11 | ||
| Niger | 1,134.17 | 0.00 | ||
| Nicaragua | 272,474.78 | 0.01 | ||
| Namibia | 81,921.39 | 0.00 | ||
| Myanmar | 82,482.49 | 0.00 | ||
| Mozambique | 29,000.00 | 0.00 | ||
| Montserrat | 283.30 | 0.00 | ||
| Mauritius | 74,440.07 | 0.00 | ||
| Maldives | 9,550.21 | 0.00 | ||
| Malawi | 83,735.37 | 0.00 | ||
| Madagascar | 29,492.88 | 0.00 | ||
| Lesotho | 240.98 | 0.00 | ||
| Kyrgyz Republic | 25,954.00 | 0.00 | ||
| Jamaica | 4,110.20 | 0.00 | ||
| Honduras | 237,077.38 | 0.01 | ||
| Gabon | 34,613.98 | 0.00 | ||
| French Polynesia | 24,949.98 | 0.00 | ||
| Fiji | 45,063.71 | 0.00 | ||
| Ethiopia | 152,204.44 | 0.00 | ||
| Egypt | 167,004.22 | 0.00 | ||
| Dominican Republic | 47,274.38 | 0.00 | ||
| Dominica | 177.03 | 0.00 | ||
| Cyprus | 310,173.79 | 0.01 | ||
| China, Macao SAR | 145,700.74 | 0.00 | ||
| Cambodia | 22,972.61 | 0.00 | ||
| Burkina Faso | 988.72 | 0.00 | ||
| Brunei | 52,161.46 | 0.00 | ||
| Botswana | 28,428.94 | 0.00 | ||
| Bolivia | 72,609.00 | 0.00 | ||
| Benin | 7,060.01 | 0.00 | ||
| Belize | 418,608.15 | 0.02 | ||
| Barbados | 35,581.50 | 0.00 | ||
| Aruba | 2,650.27 | 0.00 | ||
| Argentina | 1,143,984.42 | 0.06 | ||
| Albania | 25,229.49 | 0.00 | ||