Kenya | Exports | Precious stones and semi-precious stones, whether or not worked or graded but not strung, mounted or set | 2023
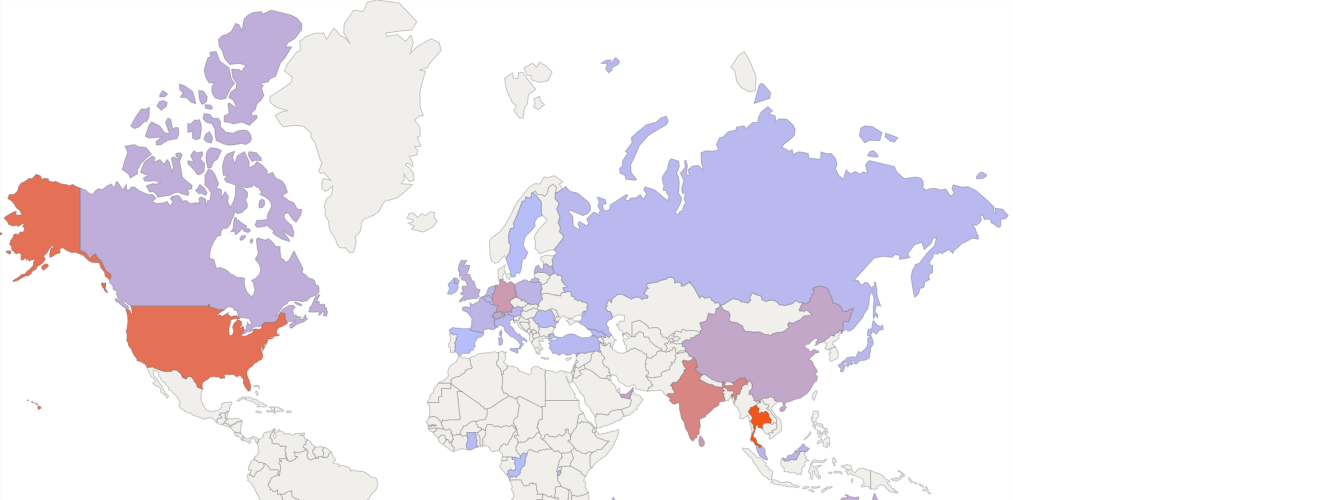
The value of exports of the group 7103 "Precious stones (other than diamonds) and semi-precious stones, whether or not worked or graded but not strung, mounted or set; ungraded precious stones (other than diamonds) and semi-precious stones, temporarily strung for convenience of transport" from Kenya was $ 5.31 million in 2023. Thailand was the largest market for exports of this commodity group from Kenya in 2023 ($ 2.34 million or 44% of total exports of the commodity group).
Other important directions of exports of «Precious stones (other than diamonds) and semi-precious stones, whether or not worked or graded but not strung, mounted or set; ungraded precious stones (other than diamonds) and semi-precious stones, temporarily strung for convenience of transport» from Kenya in 2023:
The dataset provides information on export directions of more than 6,000 commodities by reporting country and its trade partners. The database contains trade value, quantity, net weight, and unit price data. For more data, switch to table visualization and use filters on the left side of the page.
| Reporter | Commodity | Partner | Exports |
| 2023 | |||
| Value (US$) | |||
| Kenya | 7103. Precious stones (other than diamonds) and semi-precious stones, whether or not worked or graded but not strung, mounted or set; ungraded precious stones (other than diamonds) and semi-precious stones, temporarily strung for convenience of transport | Australia | 26,492.35 |
| Austria | 5,383.35 | ||
| Belgium | 1,506.59 | ||
| Burundi | 1,769.25 | ||
| Canada | 25,640.05 | ||
| China | 61,707.30 | ||
| Congo | 1.81 | ||
| France | 10,382.61 | ||
| Georgia | 1,417.41 | ||
| Germany | 169,837.48 | ||
| Ghana | 1,521.74 | ||
| Hong Kong | 720,600.63 | ||
| India | 489,478.52 | ||
| Ireland | 620.70 | ||
| Italy | 3,361.98 | ||
| Japan | 3,287.87 | ||
| Latvia | 14,327.96 | ||
| Madagascar | 2,206.55 | ||
| Malaysia | 9,023.93 | ||
| Netherlands | 8,543.97 | ||
| Poland | 9,613.91 | ||
| Romania | 790.51 | ||
| Russia | 3,048.37 | ||
| Singapore | 3,187.04 | ||
| South Africa | 225.89 | ||
| Spain | 100.96 | ||
| Sri Lanka | 150,943.47 | ||
| Sudan | 220.65 | ||
| Swaziland | 22,091.58 | ||
| Sweden | 318.79 | ||
| Switzerland | 43,899.14 | ||
| Thailand | 2,347,471.54 | ||
| Turkey | 2,540.31 | ||
| United Arab Emirates | 75,606.73 | ||
| United Kingdom | 21,163.60 | ||
| USA | 1,081,242.15 |