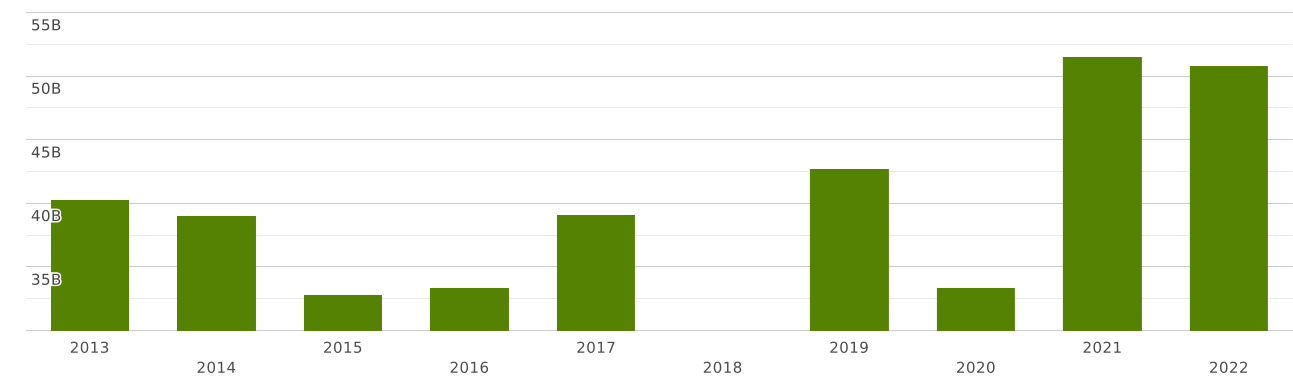
ASEAN | Imports and Exports | World | Iron and steel | Value (US$) and Value Growth, YoY (%) | 2013 - 2022
The value of exports of commodity group 72 "Iron and steel" from ASEAN totalled $ 37 billion in 2022. Sales of commodity group 72 from ASEAN went up by 5.92% compared to 2021: exports of commodity group 72 "Iron and steel" went up by $ 2.11 billion (cumulative exports of commodity group 72 from ASEAN amounted $35 billion in 2021)
Exports of commodity group 72 "Iron and steel" amounted to 2.49% of total exports from ASEAN (cumulative merchandise exports from ASEAN totalled $ 1.51 trillion in 2022). The share of commodity group 72 in total exports from ASEAN decreased by 0.159 p.p. compared to 2021 (it was 2.65% in 2021 and cumulative exports from ASEAN were equal to $ 1.34 trillion).
Where does ASEAN export Iron and steel?
Top export destinations of "Iron and steel" from ASEAN in 2022:
- China with a share of 53% (20 billion US$)
- Other Asia, nes with a share of 7.43% (2.8 billion US$)
- India with a share of 6.01% (2.26 billion US$)
- Korea with a share of 5.19% (1.96 billion US$)
- USA with a share of 4.66% (1.76 billion US$)
- Italy with a share of 3.66% (1.38 billion US$)
- Hong Kong with a share of 3.21% (1.21 billion US$)
- Belgium with a share of 2.76% (1.04 billion US$)
- Japan with a share of 2.28% (862 million US$)
- Spain with a share of 1.71% (647 million US$)
Exports structure of 72 - Iron and steel - from ASEAN in 2022 represented by the following main commodity groups:
- 41% (15.4 billion US$): 7202 - Ferro-alloys.
- 17.2% (6.5 billion US$): 7219 - Flat-rolled products of stainless steel, of a width of 600 mm or more
- 10.7% (4.07 billion US$): 7218 - Stainless steel in ingots or other primary forms; semi-finished products of stainless steel
- 5.69% (2.15 billion US$): 7210 - Flat-rolled products of iron or non-alloy steel, of a width of 600 mm or more, clad, plated or coated
- 5.02% (1.89 billion US$): 7214 - Other bars and rods of iron or non-alloy steel, not further worked than forged, hot-rolled, hot-drawn or hot-extruded, but including those twisted after rolling
- 4.47% (1.68 billion US$): 7213 - Bars and rods, hot-rolled, in irregularly wound coils, of iron or non-alloy steel
- 4.06% (1.53 billion US$): 7207 - Semi-finished products of iron or non-alloy steel
- 3.06% (1.15 billion US$): 7208 - Flat-rolled products of iron or non-alloy steel, of a width of 600 mm or more, hot-rolled, not clad, plated or coated
- 2.45% (928 million US$): 7204 - Ferrous waste and scrap; remelting scrap ingots of iron or steel.
- 0.832% (314 million US$): 7203 - Ferrous products obtained by direct reduction of iron ore and other spongy ferrous products, in lumps, pellets or similar forms; iron having a minimum purity by weight of 99.94 %, in lumps, pellets or similar forms
The value of imports of commodity group 72 "Iron and steel" to ASEAN totalled $ 50 billion in 2022. Sales of commodity group 72 to ASEAN decreased by 1.42% in value terms compared to 2021. imports of commodity group 72 "Iron and steel" decreased by $ 732 million (the value of imports of commodity group 72 to ASEAN was equal to $51 billion in 2021)
Imports of commodity group 72 "Iron and steel" accounted for 3.43% of total import flow to ASEAN (in 2022, total imports to ASEAN amounted to $ 1.47 trillion). The share of commodity group 72 in total imports to ASEAN decreased by 0.566 p.p. compared to 2021 (it was 4% in 2021 and cumulative imports to ASEAN were equal to $ 1.28 trillion).
Where does ASEAN import Iron and steel from?
Top trading partners (import of "Iron and steel") of ASEAN in 2022:
- China with a share of 33% (17.1 billion US$)
- Japan with a share of 24% (12.5 billion US$)
- Korea with a share of 10.9% (5.57 billion US$)
- Other Asia, nes with a share of 6.41% (3.25 billion US$)
- Oman with a share of 4.42% (2.24 billion US$)
- India with a share of 3.9% (1.98 billion US$)
- South Africa with a share of 3.54% (1.8 billion US$)
- Russia with a share of 2.8% (1.42 billion US$)
- USA with a share of 1.58% (803 million US$)
- Australia with a share of 1.35% (686 million US$)
Imports structure of 72 - Iron and steel - to ASEAN in 2022 represented by the following main commodity groups:
- 22% (11.2 billion US$): 7208 - Flat-rolled products of iron or non-alloy steel, of a width of 600 mm or more, hot-rolled, not clad, plated or coated
- 13% (6.64 billion US$): 7210 - Flat-rolled products of iron or non-alloy steel, of a width of 600 mm or more, clad, plated or coated
- 10.4% (5.29 billion US$): 7225 - Flat-rolled products of other alloy steel, of a width of 600 mm or more
- 8.33% (4.23 billion US$): 7207 - Semi-finished products of iron or non-alloy steel
- 7.73% (3.92 billion US$): 7202 - Ferro-alloys.
- 5.95% (3.02 billion US$): 7204 - Ferrous waste and scrap; remelting scrap ingots of iron or steel.
- 5.51% (2.8 billion US$): 7209 - Flat-rolled products of iron or non-alloy steel, of a width of 600 mm or more, cold-rolled (cold-reduced), not clad, plated or coated
- 5.15% (2.61 billion US$): 7219 - Flat-rolled products of stainless steel, of a width of 600 mm or more
- 2.8% (1.42 billion US$): 7228 - Other bars and rods of other alloy steel; angles, shapes and sections, of other alloy steel; hollow drill bars and rods, of alloy or non-alloy steel
- 2.76% (1.4 billion US$): 7216 - Angles, shapes and sections of iron or non-alloy steel