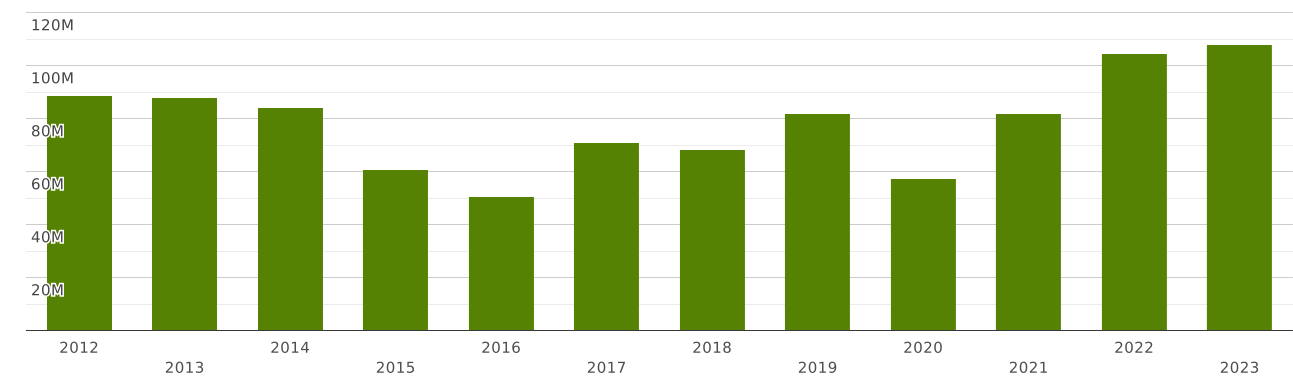
Armenia | Imports and Exports | World | Meat and edible meat offal | Value (US$) and Value Growth, YoY (%) | 2012 - 2023
The value of exports of commodity group 02 "Meat and edible meat offal" from Armenia totalled $ 6.36 million in 2023. Sales of commodity group 02 from Armenia went up by 256% compared to 2022: exports of commodity group 02 "Meat and edible meat offal" went up by $ 4.57 million (cumulative exports of commodity group 02 from Armenia amounted $1.78 million in 2022)
Exports of commodity group 02 "Meat and edible meat offal" amounted to 0.076% of total exports from Armenia (cumulative merchandise exports from Armenia totalled $ 8.37 billion in 2023). The share of commodity group 02 in total exports from Armenia increased by 0.042 p.p. compared to 2022 (it was 0.033% in 2022 and cumulative exports from Armenia were equal to $ 5.3 billion).
Where does Armenia export Meat and edible meat offal?
Top export destinations of "Meat and edible meat offal" from Armenia in 2023:
- Iran with a share of 63% (4.05 million US$)
- Russia with a share of 18.3% (1.17 million US$)
- Georgia with a share of 6.03% (383 thousand US$)
- India with a share of 4.51% (287 thousand US$)
- Iraq with a share of 3.44% (219 thousand US$)
- Ukraine with a share of 1.63% (103 thousand US$)
- Qatar - 50 thousand US$
- Belarus - 36 thousand US$
- Germany - 36 thousand US$
- United Arab Emirates - 16 thousand US$
Exports structure of 02 - Meat and edible meat offal - from Armenia in 2023 represented by the following main commodity groups:
- 64% (4.12 million US$): 0204 - Meat of sheep or goats, fresh, chilled or frozen.
- 11.1% (709 thousand US$): 0207 - Meat and edible offal, of the poultry of heading 01.05, fresh, chilled or frozen.
- 10.4% (662 thousand US$): 0206 - Edible offal of bovine animals, swine, sheep, goats, horses, asses, mules
- 7.91% (503 thousand US$): 0210 - Meat and edible meat offal, salted, in brine, dried or smoked; edible flours and
- 5.61% (357 thousand US$): 0202 - Meat of bovine animals, frozen
- 0.07% (4.47 thousand US$): 0201 - Meat of bovine animals, fresh or chilled.
The value of imports of commodity group 02 "Meat and edible meat offal" to Armenia totalled $ 107 million in 2023. Sales of commodity group 02 to Armenia went up by 3.24% compared to 2022: imports of commodity group 02 "Meat and edible meat offal" went up by $ 3.39 million (the value of imports of commodity group 02 to Armenia was equal to $104 million in 2022)
Imports of commodity group 02 "Meat and edible meat offal" accounted for 0.897% of total import flow to Armenia (in 2023, total imports to Armenia amounted to $ 12 billion). The share of commodity group 02 in total imports to Armenia decreased by 0.313 p.p. compared to 2022 (it was 1.21% in 2022 and cumulative imports to Armenia were equal to $ 8.63 billion).
Where does Armenia import Meat and edible meat offal from?
Top trading partners (import of "Meat and edible meat offal") of Armenia in 2023:
- Russia with a share of 30% (33 million US$)
- Brazil with a share of 25% (26 million US$)
- Ukraine with a share of 13.5% (14.6 million US$)
- India with a share of 9.57% (10.3 million US$)
- USA with a share of 8.42% (9.09 million US$)
- Georgia with a share of 4.25% (4.59 million US$)
- Italy with a share of 2.48% (2.68 million US$)
- Germany with a share of 1.95% (2.11 million US$)
- Belarus with a share of 1.04% (1.12 million US$)
- Belgium - 738 thousand US$
Imports structure of 02 - Meat and edible meat offal - to Armenia in 2023 represented by the following main commodity groups:
- 55% (59 million US$): 0207 - Meat and edible offal, of the poultry of heading 01.05, fresh, chilled or frozen.
- 22% (24 million US$): 0203 - Meat of swine, fresh, chilled or frozen.
- 14.2% (15.3 million US$): 0202 - Meat of bovine animals, frozen
- 4.19% (4.52 million US$): 0209 - Pig fat, free of lean meat, and poultry fat, not rendered or otherwise extracted, fresh, chilled, frozen, salted, in brine, dried or smoked
- 2.41% (2.6 million US$): 0206 - Edible offal of bovine animals, swine, sheep, goats, horses, asses, mules
- 0.862% (930 thousand US$): 0210 - Meat and edible meat offal, salted, in brine, dried or smoked; edible flours and
- 0.225% (243 thousand US$): 0201 - Meat of bovine animals, fresh or chilled.
- 0.09% (97 thousand US$): 0204 - Meat of sheep or goats, fresh, chilled or frozen.
- 0.008% (9.34 thousand US$): 0208 - Other meat and edible meat offal, fresh, chilled or frozen