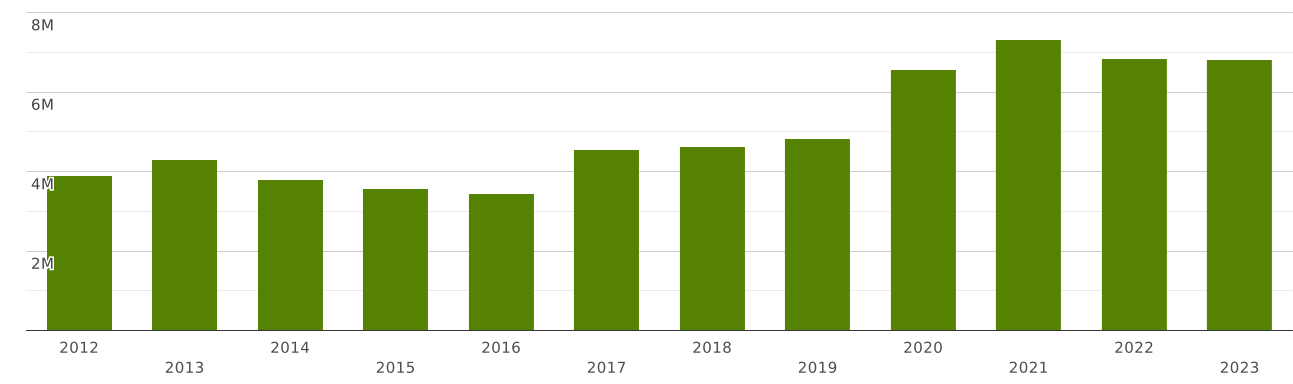
Australia | Imports and Exports | World | Live fish. | Value (US$) and Value Growth, YoY (%) | 2012 - 2023
The value of exports of commodity group 0301 "Live fish." from Australia totalled $ 13.9 million in 2023. Sales of commodity group 0301 from Australia went up by 34% compared to 2022: exports of commodity group 0301 "Live fish." went up by $ 3.6 million (cumulative exports of commodity group 0301 from Australia amounted $10.3 million in 2022)
Exports of commodity group 0301 "Live fish." amounted to 0.003% of total exports from Australia (cumulative merchandise exports from Australia totalled $ 369 billion in 2023). The share of commodity group 0301 in total exports from Australia increased by 0.001 p.p. compared to 2022 (it was 0.002% in 2022 and cumulative exports from Australia were equal to $ 410 billion).
Exports of commodity group 0301 amounted to 1.6% of total sales of group "" from Australia in 2023 (the value of exports of commodity group from Australia amounted to $869 million in 2023). The share of exports of commodity group 0301 in sales of commodity group from Australia increased by 0.34 p.p. compared to 2022 (it was 1.26% in 2022, and exports of commodity group from Australia were $818 million).
Where does Australia export Live fish.?
Top export destinations of "Live fish." from Australia in 2023:
- Hong Kong with a share of 35% (4.94 million US$)
- Iran with a share of 26% (3.64 million US$)
- USA with a share of 17.2% (2.41 million US$)
- Korea with a share of 4.49% (629 thousand US$)
- China with a share of 3.09% (433 thousand US$)
- United Arab Emirates with a share of 2.98% (417 thousand US$)
- Other Asia, nes with a share of 1.81% (253 thousand US$)
- Israel with a share of 1.69% (237 thousand US$)
- Japan with a share of 1.41% (198 thousand US$)
- Indonesia - 109 thousand US$
Exports structure of 0301 - Live fish. - from Australia in 2023 represented by the following main commodity groups:
- 38% (5.39 million US$): 030199 - Live fish, n.e.s.
- 10.6% (1.49 million US$): 030191 - Live trout (Salmo trutta, Oncorhynchus mykiss/clarki/aguabonita/gilae/apache/chrysogaster)
- 0.825% (115 thousand US$): 030192 - Live eels (Anguilla spp.)
The value of imports of commodity group 0301 "Live fish." to Australia totalled $ 6.82 million in 2023. Sales of commodity group 0301 to Australia decreased by 0.236% in value terms compared to 2022. imports of commodity group 0301 "Live fish." decreased by $ 16.1 thousand (the value of imports of commodity group 0301 to Australia was equal to $6.84 million in 2022)
Imports of commodity group 0301 "Live fish." accounted for 0.002% of total import flow to Australia (in 2023, total imports to Australia amounted to $ 287 billion). The share of commodity group 0301 in total imports to Australia decreased by 0 p.p. compared to 2022 (it was 0.002% in 2022 and cumulative imports to Australia were equal to $ 309 billion).
Imports of commodity group 0301 reached 0.748% of total imports of group "" to Australia in 2023 (imports of commodity group to Australia totalled $912 million in 2023). The share of purchases of commodity group 0301 in total imports of commodity group to Australia increased by 0.081 p.p. compared to 2022 (it was 0.666% in 2022, and imports of commodity group to Australia accounted for $1.02 billion).
Where does Australia import Live fish. from?
Top trading partners (import of "Live fish.") of Australia in 2023:
- Indonesia with a share of 36% (2.52 million US$)
- Singapore with a share of 25% (1.71 million US$)
- Sri Lanka with a share of 14.8% (1.01 million US$)
- Malaysia with a share of 8.4% (573 thousand US$)
- Thailand with a share of 8.23% (561 thousand US$)
- China with a share of 3.08% (210 thousand US$)
- Philippines with a share of 1.08% (74 thousand US$)
- USA with a share of 1.04% (71 thousand US$)
- Germany - 37 thousand US$
- Fiji - 17.8 thousand US$
Imports structure of 0301 - Live fish. - to Australia in 2023 represented by the following main commodity groups:
- 0.112% (7.69 thousand US$): 030193 - Live carp