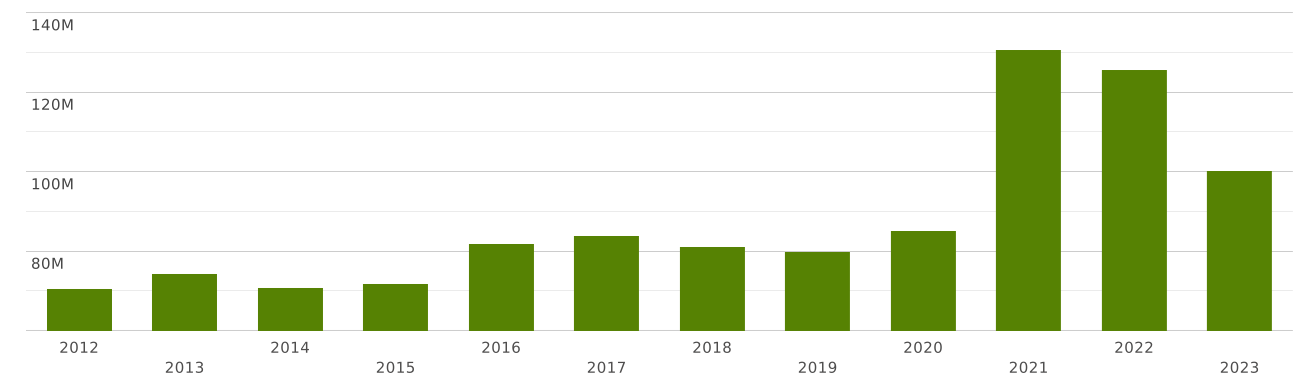
Australia | Imports and Exports | World | Blankets and travelling rugs | Value (US$) and Value Growth, YoY (%) | 2012 - 2023
The value of exports of commodity group 6301 "Blankets and travelling rugs." from Australia totalled $ 3.13 million in 2023. Sales of commodity group 6301 from Australia went up by 25% compared to 2022: exports of commodity group 6301 "Blankets and travelling rugs." went up by $ 636 thousand (cumulative exports of commodity group 6301 from Australia amounted $2.49 million in 2022)
Exports of commodity group 6301 amounted to 2.06% of total sales of group "" from Australia in 2023 (the value of exports of commodity group from Australia amounted to $151 million in 2023). The share of exports of commodity group 6301 in sales of commodity group from Australia increased by 0.353 p.p. compared to 2022 (it was 1.7% in 2022, and exports of commodity group from Australia were $145 million).
Where does Australia export Blankets and travelling rugs.?
Top export destinations of "Blankets and travelling rugs." from Australia in 2023:
- New Zealand with a share of 32% (1 million US$)
- China with a share of 13% (409 thousand US$)
- Korea with a share of 8.51% (266 thousand US$)
- USA with a share of 8.06% (252 thousand US$)
- Papua New Guinea with a share of 5.98% (187 thousand US$)
- Vietnam with a share of 5.13% (160 thousand US$)
- United Kingdom with a share of 4.38% (137 thousand US$)
- Romania with a share of 3.66% (114 thousand US$)
- Singapore with a share of 3.64% (114 thousand US$)
- Japan with a share of 2.66% (83 thousand US$)
Exports structure of 6301 - Blankets and travelling rugs. - from Australia in 2023 represented by the following main commodity groups:
- 30% (969 thousand US$): 630120 - Blankets (excl. elec.) & travelling rugs, of wool/of fine animal hair
- 29% (929 thousand US$): 630190 - Blankets (excl. elec.) & travelling rugs other than of wool/fine animal hair/cotton/synth. fibres
- 18.9% (592 thousand US$): 630130 - Blankets (excl. elec.) & travelling rugs, of cotton
- 11.8% (372 thousand US$): 630140 - Blankets (excl. elec.) & travelling rugs, of synth. fibres
- 8.54% (267 thousand US$): 630110 - Electric blankets
The value of imports of commodity group 6301 "Blankets and travelling rugs." to Australia totalled $ 100 million in 2023. Sales of commodity group 6301 to Australia decreased by 20% in value terms compared to 2022. imports of commodity group 6301 "Blankets and travelling rugs." decreased by $ 25 million (the value of imports of commodity group 6301 to Australia was equal to $125 million in 2022)
Imports of commodity group 6301 "Blankets and travelling rugs." accounted for 0.034% of total import flow to Australia (in 2023, total imports to Australia amounted to $ 287 billion). The share of commodity group 6301 in total imports to Australia decreased by 0.005 p.p. compared to 2022 (it was 0.04% in 2022 and cumulative imports to Australia were equal to $ 309 billion).
Imports of commodity group 6301 reached 6.14% of total imports of group "" to Australia in 2023 (imports of commodity group to Australia totalled $1.63 billion in 2023). The share of purchases of commodity group 6301 in total imports of commodity group to Australia increased by 0.82 p.p. compared to 2022 (it was 5.32% in 2022, and imports of commodity group to Australia accounted for $2.36 billion).
Where does Australia import Blankets and travelling rugs. from?
Top trading partners (import of "Blankets and travelling rugs.") of Australia in 2023:
- China with a share of 84% (84 million US$)
- India with a share of 6.75% (6.77 million US$)
- Pakistan with a share of 1.98% (1.99 million US$)
- United Kingdom with a share of 1.44% (1.44 million US$)
- Italy with a share of 1.11% (1.12 million US$)
- Turkey - 664 thousand US$
- Portugal - 634 thousand US$
- France - 543 thousand US$
- Bangladesh - 483 thousand US$
- USA - 448 thousand US$
Imports structure of 6301 - Blankets and travelling rugs. - to Australia in 2023 represented by the following main commodity groups:
- 52% (52 million US$): 630140 - Blankets (excl. elec.) & travelling rugs, of synth. fibres
- 21% (21 million US$): 630110 - Electric blankets
- 14.3% (14.4 million US$): 630130 - Blankets (excl. elec.) & travelling rugs, of cotton
- 6.52% (6.54 million US$): 630120 - Blankets (excl. elec.) & travelling rugs, of wool/of fine animal hair
- 4.57% (4.59 million US$): 630190 - Blankets (excl. elec.) & travelling rugs other than of wool/fine animal hair/cotton/synth. fibres