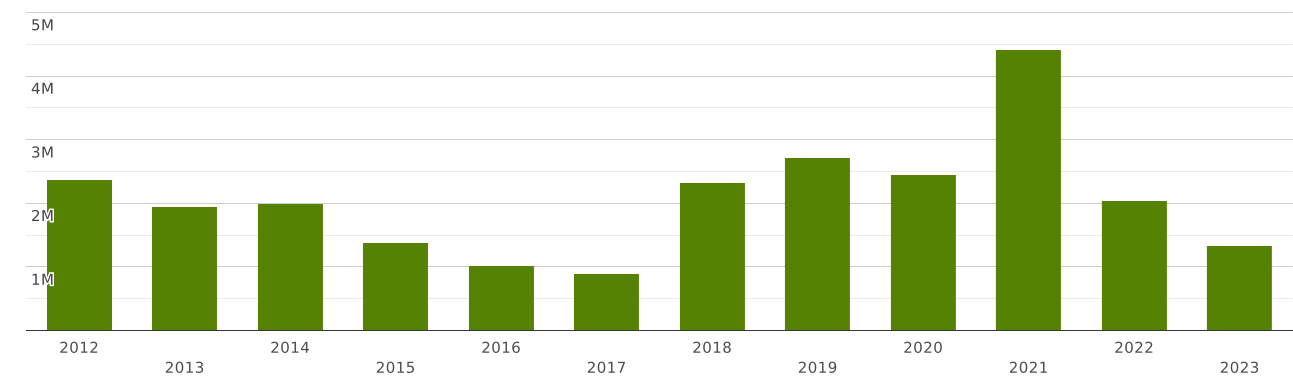
Australia | Imports and Exports | World | Copper powders and flakes | Value (US$) and Value Growth, YoY (%) | 2012 - 2023
The value of exports of commodity group 7406 "Copper powders and flakes" from Australia totalled $ 42 million in 2023. Sales of commodity group 7406 from Australia went up by 219% compared to 2022: exports of commodity group 7406 "Copper powders and flakes" went up by $ 29 million (cumulative exports of commodity group 7406 from Australia amounted $13.3 million in 2022)
Exports of commodity group 7406 "Copper powders and flakes" amounted to 0.011% of total exports from Australia (cumulative merchandise exports from Australia totalled $ 369 billion in 2023). The share of commodity group 7406 in total exports from Australia increased by 0.008 p.p. compared to 2022 (it was 0.003% in 2022 and cumulative exports from Australia were equal to $ 410 billion).
Exports of commodity group 7406 amounted to 1.03% of total sales of group "" from Australia in 2023 (the value of exports of commodity group from Australia amounted to $4.13 billion in 2023). The share of exports of commodity group 7406 in sales of commodity group from Australia increased by 0.691 p.p. compared to 2022 (it was 0.339% in 2022, and exports of commodity group from Australia were $3.93 billion).
Where does Australia export Copper powders and flakes?
Top export destinations of "Copper powders and flakes" from Australia in 2023:
- Malaysia with a share of 76% (32 million US$)
- Thailand with a share of 10.4% (4.43 million US$)
- Other Asia, nes with a share of 4.54% (1.93 million US$)
- Brazil with a share of 3.32% (1.41 million US$)
- China with a share of 1.39% (596 thousand US$)
- Turkey with a share of 1.35% (577 thousand US$)
- Belgium with a share of 1.07% (459 thousand US$)
- Pakistan - 283 thousand US$
- Hong Kong - 202 thousand US$
- United Kingdom - 69 thousand US$
Exports structure of 7406 - Copper powders and flakes - from Australia in 2023 represented by the following main commodity groups:
- 89% (38 million US$): 740620 - Powders of lamellar structure, of copper; flakes, of copper
- 10.8% (4.6 million US$): 740610 - Powders of non-lamellar structure, of copper
The value of imports of commodity group 7406 "Copper powders and flakes" to Australia totalled $ 1.33 million in 2023. Sales of commodity group 7406 to Australia decreased by 34% in value terms compared to 2022. imports of commodity group 7406 "Copper powders and flakes" decreased by $ 714 thousand (the value of imports of commodity group 7406 to Australia was equal to $2.04 million in 2022)
Imports of commodity group 7406 reached 0.149% of total imports of group "" to Australia in 2023 (imports of commodity group to Australia totalled $889 million in 2023). The share of purchases of commodity group 7406 in imports of commodity group to Australia went down by 0.056 p.p. compared to 2022 (it was 0.206% in 2022, and imports of commodity group to Australia accounted for $990 million).
Where does Australia import Copper powders and flakes from?
Top trading partners (import of "Copper powders and flakes") of Australia in 2023:
- Italy with a share of 24% (332 thousand US$)
- China with a share of 17.4% (232 thousand US$)
- Spain with a share of 10.1% (135 thousand US$)
- United Kingdom with a share of 9.55% (127 thousand US$)
- New Zealand with a share of 9.46% (126 thousand US$)
- Czech Republic with a share of 8.51% (113 thousand US$)
- Other Asia, nes with a share of 6.9% (92 thousand US$)
- Germany with a share of 4.66% (62 thousand US$)
- India with a share of 3.6% (48 thousand US$)
- USA with a share of 2.49% (33 thousand US$)
Imports structure of 7406 - Copper powders and flakes - to Australia in 2023 represented by the following main commodity groups:
- 64% (863 thousand US$): 740610 - Powders of non-lamellar structure, of copper
- 35% (469 thousand US$): 740620 - Powders of lamellar structure, of copper; flakes, of copper