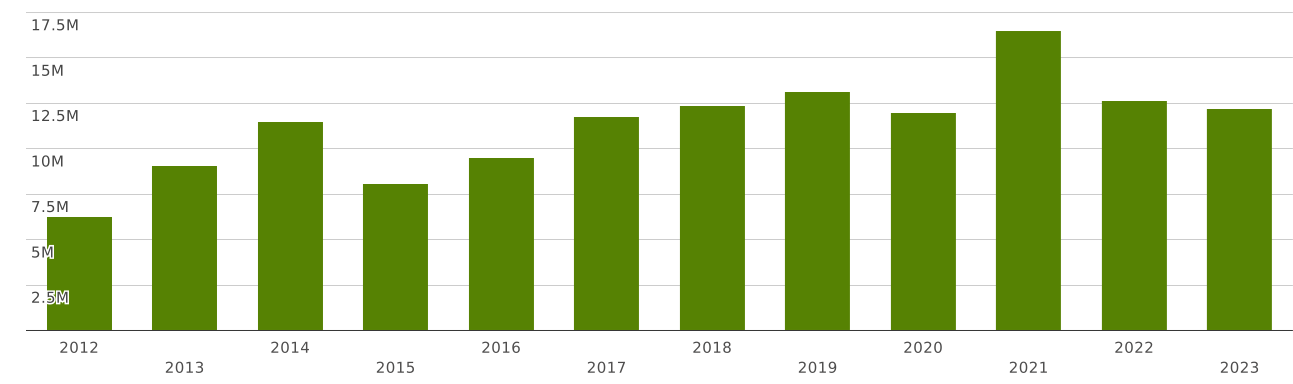
China | Imports and Exports | World | Dried vegetables, whole, cut, sliced, broken or in powder | Value (US$) and Value Growth, YoY (%) | 2012 - 2023
| Commodity | Reporter | Partner | Trade flow | Indicator | 2012 | 2013 | 2014 | 2015 | 2016 | 2017 | 2018 | 2019 | 2020 | 2021 | 2022 | 2023 |
| 0712. Dried vegetables, whole, cut, sliced, broken or in powder, but not further prepared | China | World | Exports | Value (US$) | 1,546,970,716.00 | 2,302,167,200.00 | 2,429,670,587.00 | 2,811,691,230.00 | 3,241,124,956.00 | 3,979,415,085.00 | 4,021,901,496.00 | 2,939,370,219.00 | 2,136,070,870.00 | 2,179,270,774.00 | 1,950,937,452.00 | 1,809,154,138.00 |
| Value Growth, YoY (%) | -40.89 | 48.81 | 5.53 | 15.72 | 15.27 | 22.77 | 1.06 | -26.91 | -27.32 | 2.02 | -10.47 | -7.26 | ||||
| Imports | Value (US$) | 6,271,582.00 | 9,095,569.00 | 11,507,342.00 | 8,091,170.00 | 9,540,013.00 | 11,773,598.00 | 12,386,875.00 | 13,138,894.00 | 11,988,439.00 | 16,520,214.00 | 12,681,712.00 | 12,193,019.00 | |||
| Value Growth, YoY (%) | -2.22 | 45.02 | 26.51 | -29.68 | 17.90 | 23.41 | 5.20 | 6.07 | -8.75 | 37.80 | -23.23 | -3.85 |
The value of exports of commodity group 0712 "Dried vegetables, whole, cut, sliced, broken or in powder, but not further prepared" from China totalled $ 1.8 billion in 2023. Sales of commodity group 0712 from China decreased by 7.26% in value terms compared to 2022. exports of commodity group 0712 "Dried vegetables, whole, cut, sliced, broken or in powder, but not further prepared" decreased by $ 141 million (cumulative exports of commodity group 0712 from China amounted $1.95 billion in 2022)
Exports of commodity group 0712 "Dried vegetables, whole, cut, sliced, broken or in powder, but not further prepared" amounted to 0.053% of total exports from China (cumulative merchandise exports from China totalled $ 3.37 trillion in 2023). The share of commodity group 0712 in total exports from China decreased by 0 p.p. compared to 2022 (it was 0.054% in 2022 and cumulative exports from China were equal to $ 3.59 trillion).
Exports of commodity group 0712 amounted to 16.4% of total sales of group "" from China in 2023 (the value of exports of commodity group from China amounted to $10.9 billion in 2023). The share of exports of commodity group 0712 in sales of commodity group from China lowered by 2.72 p.p. compared to 2022 (it was 19.1% in 2022, and exports of commodity group from China were $10.1 billion).
Where does China export Dried vegetables, whole, cut, sliced, broken or in powder, but not further prepared?
Top export destinations of "Dried vegetables, whole, cut, sliced, broken or in powder, but not further prepared" from China in 2023:
- USA with a share of 17.8% (322 million US$)
- Japan with a share of 13.5% (246 million US$)
- Vietnam with a share of 12.7% (231 million US$)
- Hong Kong with a share of 8.38% (151 million US$)
- Thailand with a share of 7.14% (129 million US$)
- Korea with a share of 5.84% (105 million US$)
- Malaysia with a share of 3.89% (70 million US$)
- Germany with a share of 2.77% (50 million US$)
- Russia with a share of 2.49% (45 million US$)
- Brazil with a share of 2.36% (42 million US$)
Exports structure of 0712 - Dried vegetables, whole, cut, sliced, broken or in powder, but not further prepared - from China in 2023 represented by the following main commodity groups:
- 48% (870 million US$): 071290 - Dried vegetables, n.e.s.; mixtures. of dried vegetables, whole/cut/sliced/broken/in powder but not further prepared
- 15% (273 million US$): 071232 - Wood ears (Auricularia spp.), dried, whole/cut/sliced/broken/in powder but not further prepared
- 4.54% (82 million US$): 071239 - Mushrooms (excl. of 0712.31-0712.33) & truffles, dried, whole/cut/sliced/broken/in powder but not further prepared
- 3.88% (70 million US$): 071233 - Jelly fungi (Tremella spp.), dried, whole/cut/sliced/broken/in powder but not further prepared
- 2.3% (41 million US$): 071220 - Onions, dried, whole/cut/sliced/broken/in powder but not further prepared
- 0.182% (3.3 million US$): 071231 - Mushrooms of the genus Agaricus, dried, whole/cut/sliced/broken/in powder but not further prepared
The value of imports of commodity group 0712 "Dried vegetables, whole, cut, sliced, broken or in powder, but not further prepared" to China totalled $ 12.1 million in 2023. Sales of commodity group 0712 to China decreased by 3.85% in value terms compared to 2022. imports of commodity group 0712 "Dried vegetables, whole, cut, sliced, broken or in powder, but not further prepared" decreased by $ 488 thousand (the value of imports of commodity group 0712 to China was equal to $12.6 million in 2022)
Imports of commodity group 0712 reached 0.362% of total imports of group "" to China in 2023 (imports of commodity group to China totalled $3.36 billion in 2023). The share of purchases of commodity group 0712 in total imports of commodity group to China increased by 0.036 p.p. compared to 2022 (it was 0.325% in 2022, and imports of commodity group to China accounted for $3.89 billion).
Where does China import Dried vegetables, whole, cut, sliced, broken or in powder, but not further prepared from?
Top trading partners (import of "Dried vegetables, whole, cut, sliced, broken or in powder, but not further prepared") of China in 2023:
- Indonesia with a share of 45% (5.59 million US$)
- Myanmar with a share of 25% (3.15 million US$)
- Chile with a share of 12.5% (1.53 million US$)
- China with a share of 6.94% (846 thousand US$)
- India with a share of 3.87% (472 thousand US$)
- Malaysia with a share of 2.74% (334 thousand US$)
- Japan - 93 thousand US$
- Serbia - 76 thousand US$
- Egypt - 30 thousand US$
- USA - 28 thousand US$
Imports structure of 0712 - Dried vegetables, whole, cut, sliced, broken or in powder, but not further prepared - to China in 2023 represented by the following main commodity groups:
- 98% (12 million US$): 071290 - Dried vegetables, n.e.s.; mixtures. of dried vegetables, whole/cut/sliced/broken/in powder but not further prepared
- 1.12% (137 thousand US$): 071232 - Wood ears (Auricularia spp.), dried, whole/cut/sliced/broken/in powder but not further prepared
- 0% (84 US$): 071220 - Onions, dried, whole/cut/sliced/broken/in powder but not further prepared