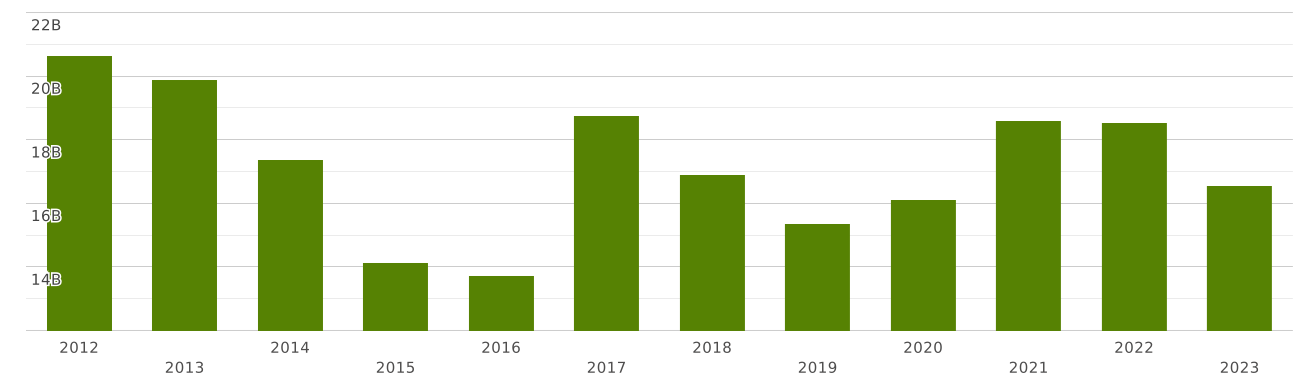
China | Imports and Exports | World | Rubber and articles thereof | Value (US$) and Value Growth, YoY (%) | 2012 - 2023
The value of exports of commodity group 40 "Rubber and articles thereof" from China totalled $ 33 billion in 2023. Sales of commodity group 40 from China went up by 6.91% compared to 2022: exports of commodity group 40 "Rubber and articles thereof" went up by $ 2.17 billion (cumulative exports of commodity group 40 from China amounted $31 billion in 2022)
Exports of commodity group 40 "Rubber and articles thereof" amounted to 0.995% of total exports from China (cumulative merchandise exports from China totalled $ 3.37 trillion in 2023). The share of commodity group 40 in total exports from China increased by 0.119 p.p. compared to 2022 (it was 0.875% in 2022 and cumulative exports from China were equal to $ 3.59 trillion).
Where does China export Rubber and articles thereof?
Top export destinations of "Rubber and articles thereof" from China in 2023:
- USA with a share of 8.49% (2.85 billion US$)
- Russia with a share of 6.71% (2.25 billion US$)
- Mexico with a share of 4.69% (1.57 billion US$)
- Brazil with a share of 3.12% (1.05 billion US$)
- Vietnam with a share of 2.86% (963 million US$)
- Australia with a share of 2.86% (963 million US$)
- United Arab Emirates with a share of 2.82% (948 million US$)
- Japan with a share of 2.8% (944 million US$)
- Saudi Arabia with a share of 2.73% (920 million US$)
- United Kingdom with a share of 2.64% (891 million US$)
Exports structure of 40 - Rubber and articles thereof - from China in 2023 represented by the following main commodity groups:
- 63% (21 billion US$): 4011 - New pneumatic tyres, of rubber
- 11.5% (3.88 billion US$): 4016 - Other articles of vulcanised rubber other than hard rubber
- 5.25% (1.76 billion US$): 4002 - Synthetic rubber and factice derived from oils, in primary forms or in plates, sheets or strip; mixtures of any product of heading 40.01 with any product of this heading, in primary forms or in plates, sheets or strip
- 4.95% (1.66 billion US$): 4015 - Articles of apparel and clothing accessories (including gloves, mittens and mitts), for all purposes, of vulcanised rubber other than hard rubber
- 4.53% (1.52 billion US$): 4010 - Conveyor or transmission belts or belting, of vulcanised rubber
- 4.45% (1.49 billion US$): 4009 - Tubes, pipes and hoses, of vulcanised rubber other than hard rubber, with or without their fittings (for example, joints, elbows, flanges)
- 1.74% (587 million US$): 4013 - Inner tubes, of rubber
- 1.45% (489 million US$): 4008 - Plates, sheets, strip, rods and profile shapes, of vulcanised rubber other than hard rubber
- 0.663% (223 million US$): 4012 - Retreaded or used pneumatic tyres of rubber; solid or cushion tyres, tyre treads and tyre flaps, of rubber
- 0.533% (179 million US$): 4014 - Hygienic or pharmaceutical articles (including teats), of vulcanised rubber other than hard rubber, with or without fittings of hard rubber
The value of imports of commodity group 40 "Rubber and articles thereof" to China totalled $ 16.5 billion in 2023. Sales of commodity group 40 to China decreased by 10.6% in value terms compared to 2022. imports of commodity group 40 "Rubber and articles thereof" decreased by $ 1.97 billion (the value of imports of commodity group 40 to China was equal to $18.5 billion in 2022)
Imports of commodity group 40 "Rubber and articles thereof" accounted for 0.648% of total import flow to China (in 2023, total imports to China amounted to $ 2.55 trillion). The share of commodity group 40 in total imports to China decreased by 0.034 p.p. compared to 2022 (it was 0.683% in 2022 and cumulative imports to China were equal to $ 2.71 trillion).
Where does China import Rubber and articles thereof from?
Top trading partners (import of "Rubber and articles thereof") of China in 2023:
- Thailand with a share of 27% (4.53 billion US$)
- Vietnam with a share of 14.1% (2.34 billion US$)
- Japan with a share of 7.78% (1.29 billion US$)
- Malaysia with a share of 7.13% (1.18 billion US$)
- Germany with a share of 4.46% (740 million US$)
- Korea with a share of 4.45% (737 million US$)
- Russia with a share of 4.26% (706 million US$)
- USA with a share of 3.99% (662 million US$)
- Côte d`Ivoire with a share of 3.87% (641 million US$)
- Indonesia with a share of 2.73% (453 million US$)
Imports structure of 40 - Rubber and articles thereof - to China in 2023 represented by the following main commodity groups:
- 49% (8.12 billion US$): 4002 - Synthetic rubber and factice derived from oils, in primary forms or in plates, sheets or strip; mixtures of any product of heading 40.01 with any product of this heading, in primary forms or in plates, sheets or strip
- 21% (3.57 billion US$): 4001 - Natural rubber, balata, gutta-percha, guayule, chicle and similar natural gums, in primary forms or in plates, sheets or strip
- 12.2% (2.02 billion US$): 4016 - Other articles of vulcanised rubber other than hard rubber
- 5.33% (884 million US$): 4011 - New pneumatic tyres, of rubber
- 3.03% (503 million US$): 4009 - Tubes, pipes and hoses, of vulcanised rubber other than hard rubber, with or without their fittings (for example, joints, elbows, flanges)
- 1.81% (300 million US$): 4005 - Compounded rubber, unvulcanised, in primary forms or in plates, sheets or strip
- 1.47% (244 million US$): 4007 - Vulcanised rubber thread and cord
- 1.32% (220 million US$): 4015 - Articles of apparel and clothing accessories (including gloves, mittens and mitts), for all purposes, of vulcanised rubber other than hard rubber
- 1.21% (201 million US$): 4010 - Conveyor or transmission belts or belting, of vulcanised rubber
- 1.03% (170 million US$): 4008 - Plates, sheets, strip, rods and profile shapes, of vulcanised rubber other than hard rubber