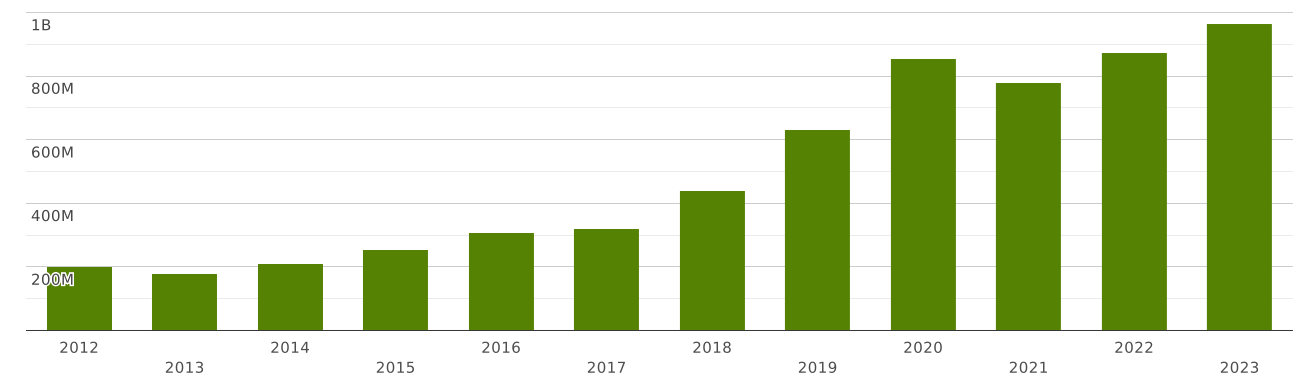
China | Imports and Exports | World | Other footwear with outer soles and uppers of rubber or plastics | Value (US$) and Value Growth, YoY (%) | 2012 - 2023
| Commodity | Reporter | Partner | Trade flow | Indicator | 2012 | 2013 | 2014 | 2015 | 2016 | 2017 | 2018 | 2019 | 2020 | 2021 | 2022 | 2023 |
| 6402. Other footwear with outer soles and uppers of rubber or plastics | China | World | Exports | Value (US$) | 18,223,691,534.00 | 22,119,685,914.00 | 26,459,132,005.00 | 24,510,404,165.00 | 21,405,223,814.00 | 21,445,892,206.00 | 19,884,159,779.00 | 20,539,796,915.00 | 16,551,034,906.00 | 22,769,823,622.00 | 28,505,217,638.00 | 26,298,741,556.00 |
| Value Growth, YoY (%) | 3.52 | 21.37 | 19.61 | -7.36 | -12.66 | 0.18 | -7.28 | 3.29 | -19.41 | 37.57 | 25.18 | -7.74 | ||||
| Imports | Value (US$) | 200,167,504.00 | 179,908,982.00 | 211,944,937.00 | 255,515,628.00 | 307,232,201.00 | 320,165,215.00 | 440,339,088.00 | 633,006,531.00 | 854,343,281.00 | 781,442,641.00 | 873,733,265.00 | 965,620,217.00 | |||
| Value Growth, YoY (%) | 22.40 | -10.12 | 17.80 | 20.55 | 20.24 | 4.20 | 37.53 | 43.75 | 34.96 | -8.53 | 11.81 | 10.51 |
The value of exports of commodity group 6402 "Other footwear with outer soles and uppers of rubber or plastics" from China totalled $ 26 billion in 2023. Sales of commodity group 6402 from China decreased by 7.74% in value terms compared to 2022. exports of commodity group 6402 "Other footwear with outer soles and uppers of rubber or plastics" decreased by $ 2.2 billion (cumulative exports of commodity group 6402 from China amounted $28 billion in 2022)
Exports of commodity group 6402 "Other footwear with outer soles and uppers of rubber or plastics" amounted to 0.778% of total exports from China (cumulative merchandise exports from China totalled $ 3.37 trillion in 2023). The share of commodity group 6402 in total exports from China decreased by 0.015 p.p. compared to 2022 (it was 0.793% in 2022 and cumulative exports from China were equal to $ 3.59 trillion).
Exports of commodity group 6402 amounted to 49% of total sales of group "" from China in 2023 (the value of exports of commodity group from China amounted to $53 billion in 2023). The share of exports of commodity group 6402 in sales of commodity group from China increased by 3.65 p.p. compared to 2022 (it was 45% in 2022, and exports of commodity group from China were $62 billion).
Where does China export Other footwear with outer soles and uppers of rubber or plastics?
Top export destinations of "Other footwear with outer soles and uppers of rubber or plastics" from China in 2023:
- USA with a share of 14.6% (3.85 billion US$)
- Russia with a share of 5.51% (1.45 billion US$)
- Kazakhstan with a share of 4.91% (1.29 billion US$)
- Philippines with a share of 4.31% (1.13 billion US$)
- Japan with a share of 3.21% (846 million US$)
- Kyrgyz Republic with a share of 3.19% (839 million US$)
- Germany with a share of 2.68% (707 million US$)
- United Arab Emirates with a share of 2.54% (670 million US$)
- Malaysia with a share of 2.51% (662 million US$)
- Vietnam with a share of 2.25% (592 million US$)
Exports structure of 6402 - Other footwear with outer soles and uppers of rubber or plastics - from China in 2023 represented by the following main commodity groups:
- 78% (20 billion US$): 640299 - Footwear (excl. waterproof) with outer soles & uppers of rubber/plastics (excl. of 6402.12-6402.91)
- 11.3% (2.98 billion US$): 640291 - Footwear (excl. waterproof) with outer soles & uppers of rubber/plastics, covering the ankle (excl. of 6402.12-6402.30)
- 6.64% (1.74 billion US$): 640220 - Footwear with outer soles & uppers of rubber/plastics, with upper straps/thongs assembled to the sole by means of plugs
- 2.98% (784 million US$): 640219 - Sports footwear other than ski-boots/cross-country ski footwear/snowboard boots, with outer soles & uppers of rubber/plastics
- 0.294% (77 million US$): 640212 - Ski-boots, cross-country ski footwear & snowboard boots, with outer soles & uppers of rubber/plastics
The value of imports of commodity group 6402 "Other footwear with outer soles and uppers of rubber or plastics" to China totalled $ 965 million in 2023. Sales of commodity group 6402 to China went up by 10.5% compared to 2022: imports of commodity group 6402 "Other footwear with outer soles and uppers of rubber or plastics" went up by $ 91 million (the value of imports of commodity group 6402 to China was equal to $873 million in 2022)
Imports of commodity group 6402 "Other footwear with outer soles and uppers of rubber or plastics" accounted for 0.037% of total import flow to China (in 2023, total imports to China amounted to $ 2.55 trillion). The share of commodity group 6402 in total imports to China increased by 0.005 p.p. compared to 2022 (it was 0.032% in 2022 and cumulative imports to China were equal to $ 2.71 trillion).
Imports of commodity group 6402 reached 15.4% of total imports of group "" to China in 2023 (imports of commodity group to China totalled $6.25 billion in 2023). The share of purchases of commodity group 6402 in total imports of commodity group to China increased by 1.4 p.p. compared to 2022 (it was 14% in 2022, and imports of commodity group to China accounted for $6.22 billion).
Where does China import Other footwear with outer soles and uppers of rubber or plastics from?
Top trading partners (import of "Other footwear with outer soles and uppers of rubber or plastics") of China in 2023:
- Vietnam with a share of 63% (608 million US$)
- Indonesia with a share of 15.2% (147 million US$)
- China with a share of 5.75% (55 million US$)
- Italy with a share of 4.34% (41 million US$)
- India with a share of 2.63% (25 million US$)
- Cambodia with a share of 2.6% (25 million US$)
- Brazil - 9.36 million US$
- Korea - 8.35 million US$
- USA - 8.28 million US$
- Myanmar - 6.42 million US$
Imports structure of 6402 - Other footwear with outer soles and uppers of rubber or plastics - to China in 2023 represented by the following main commodity groups:
- 84% (815 million US$): 640299 - Footwear (excl. waterproof) with outer soles & uppers of rubber/plastics (excl. of 6402.12-6402.91)
- 7.28% (70 million US$): 640291 - Footwear (excl. waterproof) with outer soles & uppers of rubber/plastics, covering the ankle (excl. of 6402.12-6402.30)
- 5.81% (56 million US$): 640219 - Sports footwear other than ski-boots/cross-country ski footwear/snowboard boots, with outer soles & uppers of rubber/plastics
- 1.53% (14.8 million US$): 640212 - Ski-boots, cross-country ski footwear & snowboard boots, with outer soles & uppers of rubber/plastics
- 0.874% (8.44 million US$): 640220 - Footwear with outer soles & uppers of rubber/plastics, with upper straps/thongs assembled to the sole by means of plugs