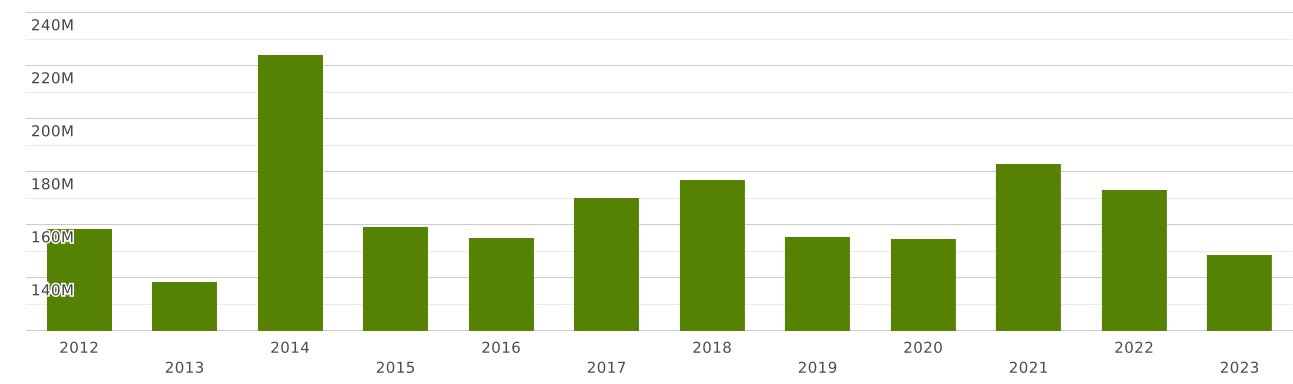
China | Imports and Exports | World | Millstones, grindstones, grinding wheels and the like (excl. of 6804.10), without frameworks, of other agglomerated abrasives/of ceramics | Value (US$) and Value Growth, YoY (%) | 2012 - 2023
The value of exports of commodity group 680422 "Millstones, grindstones, grinding wheels and the like (excl. of 6804.10), without frameworks, of other agglomerated abrasives/of ceramics" from China totalled $ 941 million in 2023. Sales of commodity group 680422 from China went up by 1.55% compared to 2022: exports of commodity group 680422 "Millstones, grindstones, grinding wheels and the like (excl. of 6804.10), without frameworks, of other agglomerated abrasives/of ceramics" went up by $ 14.4 million (cumulative exports of commodity group 680422 from China amounted $927 million in 2022)
Exports of commodity group 680422 "Millstones, grindstones, grinding wheels and the like (excl. of 6804.10), without frameworks, of other agglomerated abrasives/of ceramics" amounted to 0.027% of total exports from China (cumulative merchandise exports from China totalled $ 3.37 trillion in 2023). The share of commodity group 680422 in total exports from China increased by 0.002 p.p. compared to 2022 (it was 0.025% in 2022 and cumulative exports from China were equal to $ 3.59 trillion).
Exports of commodity group 680422 amounted to 7.22% of total sales of group "" from China in 2023 (the value of exports of commodity group from China amounted to $13 billion in 2023). The share of exports of commodity group 680422 in sales of commodity group from China increased by 1.26 p.p. compared to 2022 (it was 5.95% in 2022, and exports of commodity group from China were $15.5 billion).
Exports of commodity group 680422 amounted to 71 percent of total sales of group "" from China in 2023 (the value of exports of commodity group from China amounted to 1.31 billion USD in 2023). The share of exports of commodity group 680422 in sales of commodity group from China increased by 0.478 p.p. compared to 2022 (it was 70 percent in 2022, and exports of commodity group from China amounted to 1.3 billion USD).
Where does China export Millstones, grindstones, grinding wheels and the like (excl. of 6804.10), without frameworks, of other agglomerated abrasives/of ceramics?
Top export destinations of "Millstones, grindstones, grinding wheels and the like (excl. of 6804.10), without frameworks, of other agglomerated abrasives/of ceramics" from China in 2023:
- India with a share of 17.7% (167 million US$)
- Vietnam with a share of 5.69% (53 million US$)
- USA with a share of 5.63% (53 million US$)
- Brazil with a share of 4.56% (43 million US$)
- Thailand with a share of 4.32% (40 million US$)
- Indonesia with a share of 4.17% (39 million US$)
- Russia with a share of 4.06% (38 million US$)
- United Arab Emirates with a share of 2.84% (26 million US$)
- Malaysia with a share of 2.74% (25 million US$)
- Korea with a share of 2.46% (23 million US$)
The value of imports of commodity group 680422 "Millstones, grindstones, grinding wheels and the like (excl. of 6804.10), without frameworks, of other agglomerated abrasives/of ceramics" to China totalled $ 148 million in 2023. Sales of commodity group 680422 to China decreased by 14.2% in value terms compared to 2022. imports of commodity group 680422 "Millstones, grindstones, grinding wheels and the like (excl. of 6804.10), without frameworks, of other agglomerated abrasives/of ceramics" decreased by $ 24 million (the value of imports of commodity group 680422 to China was equal to $173 million in 2022)
Imports of commodity group 680422 "Millstones, grindstones, grinding wheels and the like (excl. of 6804.10), without frameworks, of other agglomerated abrasives/of ceramics" accounted for 0.005% of total import flow to China (in 2023, total imports to China amounted to $ 2.55 trillion). The share of commodity group 680422 in total imports to China decreased by 0 p.p. compared to 2022 (it was 0.006% in 2022 and cumulative imports to China were equal to $ 2.71 trillion).
Imports of commodity group 680422 reached 8.4% of total imports of group "" to China in 2023 (imports of commodity group to China totalled $1.76 billion in 2023). The share of purchases of commodity group 680422 in total imports of commodity group to China increased by 0.533 p.p. compared to 2022 (it was 7.87% in 2022, and imports of commodity group to China accounted for $2.2 billion).
Imports of commodity group 680422 reached 38 percent of total imports of group "" to China in 2023 (imports of commodity group to China totalled 386 million USD in 2023). The share of purchases of commodity group 680422 in total imports of commodity group to China increased by 0.108 p.p. compared to 2022 (it was 38 percent in 2022, and imports of commodity group to China accounted for 451 million USD).
Where does China import Millstones, grindstones, grinding wheels and the like (excl. of 6804.10), without frameworks, of other agglomerated abrasives/of ceramics from?
Top trading partners (import of "Millstones, grindstones, grinding wheels and the like (excl. of 6804.10), without frameworks, of other agglomerated abrasives/of ceramics") of China in 2023:
- Japan with a share of 33% (49 million US$)
- Austria with a share of 19.9% (29 million US$)
- Germany with a share of 18.2% (27 million US$)
- Other Asia, nes with a share of 5.66% (8.42 million US$)
- USA with a share of 5.25% (7.81 million US$)
- Switzerland with a share of 3.8% (5.65 million US$)
- France with a share of 3.13% (4.66 million US$)
- Korea with a share of 2.18% (3.24 million US$)
- Italy with a share of 1.96% (2.91 million US$)
- Thailand with a share of 1.08% (1.6 million US$)