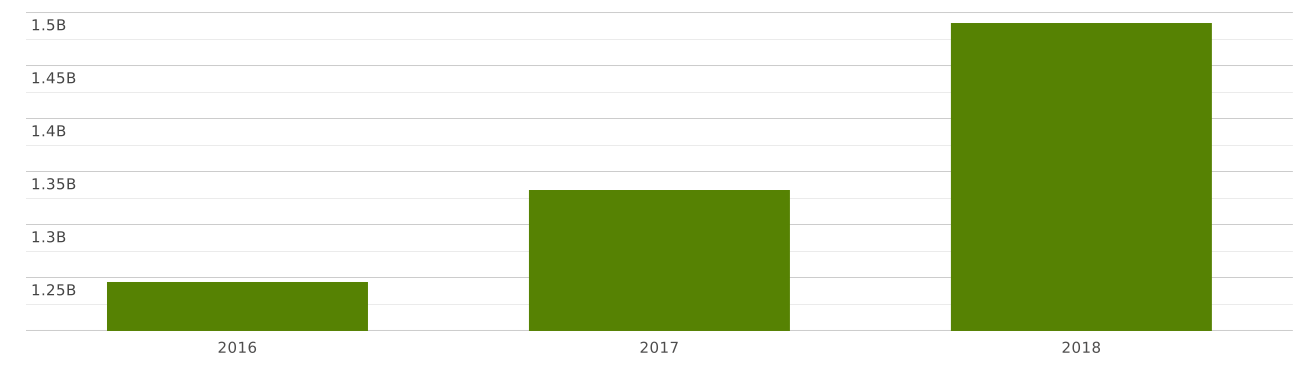
Imports and Exports | World | Other furniture and parts thereof | Value (US$) and Value Growth, YoY (%) | 2002 - 2023
The value of exports of commodity group 9403 "Other furniture and parts thereof" from ASEAN totalled $ 7.92 billion in 2018. Sales of commodity group 9403 from ASEAN went up by 4.61% compared to 2017: exports of commodity group 9403 "Other furniture and parts thereof" went up by $ 349 million (cumulative exports of commodity group 9403 from ASEAN amounted $7.57 billion in 2017)
Exports of commodity group 9403 "Other furniture and parts thereof" amounted to 0.727% of total exports from ASEAN (cumulative merchandise exports from ASEAN totalled $ 1.08 trillion in 2018). The share of commodity group 9403 in total exports from ASEAN decreased by 0.02 p.p. compared to 2017 (it was 0.748% in 2017 and cumulative exports from ASEAN were equal to $ 1.01 trillion).
Exports of commodity group 9403 amounted to 61% of total sales of group "" from ASEAN in 2018 (the value of exports of commodity group from ASEAN amounted to $12.9 billion in 2018). The share of exports of commodity group 9403 in sales of commodity group from ASEAN lowered by 2.17 p.p. compared to 2017 (it was 63% in 2017, and exports of commodity group from ASEAN were $11.9 billion).
Where does ASEAN export Other furniture and parts thereof?
Top export destinations of "Other furniture and parts thereof" from ASEAN in 2018:
- USA with a share of 53% (4.26 billion US$)
- Japan with a share of 10.2% (813 million US$)
- United Kingdom with a share of 4.91% (389 million US$)
- Australia with a share of 3.94% (312 million US$)
- China with a share of 3.38% (268 million US$)
- Canada with a share of 2.73% (216 million US$)
- Korea with a share of 2.56% (203 million US$)
- Netherlands with a share of 2.04% (162 million US$)
- France with a share of 1.87% (148 million US$)
- Germany with a share of 1.86% (148 million US$)
Exports structure of 9403 - Other furniture and parts thereof - from ASEAN in 2018 represented by the following main commodity groups:
- 40% (3.19 billion US$): 940360 - Wooden furniture (excl. of 94.01 & 9403.30-9403.50)
- 26% (2.11 billion US$): 940350 - Wooden furniture of a kind used in the bedroom
- 11.9% (949 million US$): 940390 - Parts of the furniture of 94.03
- 6.28% (497 million US$): 940340 - Wooden furniture of a kind used in the kitchen
- 5.79% (459 million US$): 940330 - Wooden furniture of a kind used in offices
- 5.12% (405 million US$): 940320 - Metal furniture (excl. of 94.01 & 94.02)
- 0.958% (75 million US$): 940310 - Metal furniture of a kind used in offices
- 0.547% (43 million US$): 940370 - Furniture of plastics (excl. of 94.01)
The value of imports of commodity group 9403 "Other furniture and parts thereof" to ASEAN totalled $ 1.49 billion in 2018. Sales of commodity group 9403 to ASEAN went up by 11.8% compared to 2017: imports of commodity group 9403 "Other furniture and parts thereof" went up by $ 157 million (the value of imports of commodity group 9403 to ASEAN was equal to $1.33 billion in 2017)
Imports of commodity group 9403 reached 29% of total imports of group "" to ASEAN in 2018 (imports of commodity group to ASEAN totalled $5.09 billion in 2018). The share of purchases of commodity group 9403 in total imports of commodity group to ASEAN increased by 0.213 p.p. compared to 2017 (it was 29% in 2017, and imports of commodity group to ASEAN accounted for $4.59 billion).
Where does ASEAN import Other furniture and parts thereof from?
Top trading partners (import of "Other furniture and parts thereof") of ASEAN in 2018:
- China with a share of 72% (1.07 billion US$)
- Italy with a share of 5.25% (78 million US$)
- Germany with a share of 2.99% (44 million US$)
- USA with a share of 2.67% (39 million US$)
- Other Asia, nes with a share of 2.65% (39 million US$)
- Japan with a share of 2.6% (38 million US$)
- Poland with a share of 1.39% (20 million US$)
- Korea with a share of 1.39% (20 million US$)
- India with a share of 1.02% (15.2 million US$)
- France - 11.1 million US$
Imports structure of 9403 - Other furniture and parts thereof - to ASEAN in 2018 represented by the following main commodity groups:
- 26% (397 million US$): 940320 - Metal furniture (excl. of 94.01 & 94.02)
- 25% (377 million US$): 940360 - Wooden furniture (excl. of 94.01 & 9403.30-9403.50)
- 11.4% (171 million US$): 940390 - Parts of the furniture of 94.03
- 7.97% (118 million US$): 940310 - Metal furniture of a kind used in offices
- 6.18% (92 million US$): 940350 - Wooden furniture of a kind used in the bedroom
- 6.09% (90 million US$): 940370 - Furniture of plastics (excl. of 94.01)
- 5.9% (88 million US$): 940330 - Wooden furniture of a kind used in offices
- 4.15% (61 million US$): 940340 - Wooden furniture of a kind used in the kitchen