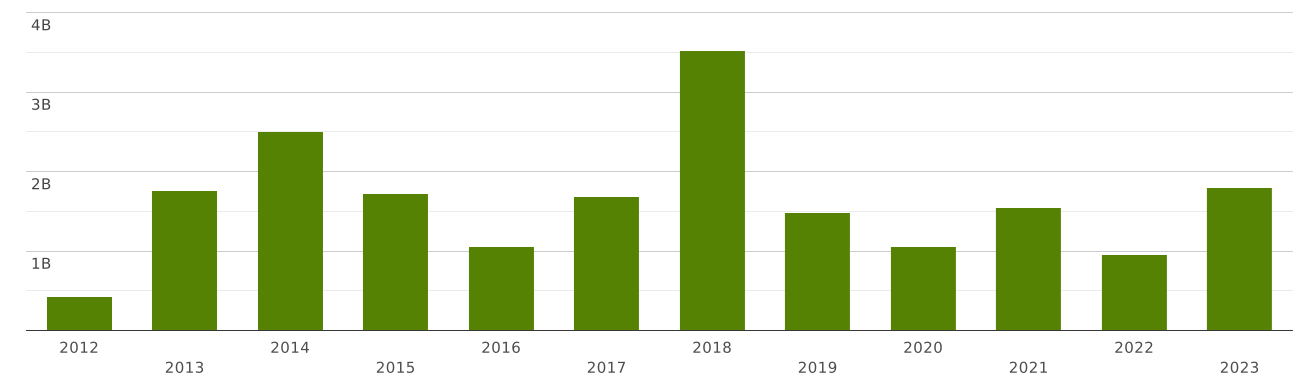
Denmark | Imports and Exports | World | Cruise ships, excursion boats, ferry-boats, cargo ships, barges and similar vessels for the transport of persons or goods | Value (US$) and Value Growth, YoY (%) | 2012 - 2023
The value of exports of commodity group 8901 "Cruise ships, excursion boats, ferry-boats, cargo ships, barges and similar vessels for the transport of persons or goods" from Denmark totalled $ 1.89 billion in 2023. Sales of commodity group 8901 from Denmark went up by 62% compared to 2022: exports of commodity group 8901 "Cruise ships, excursion boats, ferry-boats, cargo ships, barges and similar vessels for the transport of persons or goods" went up by $ 728 million (cumulative exports of commodity group 8901 from Denmark amounted $1.16 billion in 2022)
Exports of commodity group 8901 "Cruise ships, excursion boats, ferry-boats, cargo ships, barges and similar vessels for the transport of persons or goods" amounted to 1.39% of total exports from Denmark (cumulative merchandise exports from Denmark totalled $ 136 billion in 2023). The share of commodity group 8901 in total exports from Denmark increased by 0.494 p.p. compared to 2022 (it was 0.898% in 2022 and cumulative exports from Denmark were equal to $ 129 billion).
Exports of commodity group 8901 amounted to 89% of total sales of group "" from Denmark in 2023 (the value of exports of commodity group from Denmark amounted to $2.11 billion in 2023). The share of exports of commodity group 8901 in sales of commodity group from Denmark increased by 7.41 p.p. compared to 2022 (it was 81% in 2022, and exports of commodity group from Denmark were $1.42 billion).
Where does Denmark export Cruise ships, excursion boats, ferry-boats, cargo ships, barges and similar vessels for the transport of persons or goods?
Top export destinations of "Cruise ships, excursion boats, ferry-boats, cargo ships, barges and similar vessels for the transport of persons or goods" from Denmark in 2023:
- Hong Kong with a share of 21% (405 million US$)
- Marshall Islands with a share of 13.7% (261 million US$)
- Liberia with a share of 9.82% (186 million US$)
- USA with a share of 9.64% (182 million US$)
- United Kingdom with a share of 6.03% (114 million US$)
- Lebanon with a share of 5.47% (103 million US$)
- Germany with a share of 4.98% (94 million US$)
- Chile with a share of 4.27% (80 million US$)
- Saudi Arabia with a share of 3.53% (66 million US$)
- Singapore with a share of 3.33% (63 million US$)
Exports structure of 8901 - Cruise ships, excursion boats, ferry-boats, cargo ships, barges and similar vessels for the transport of persons or goods - from Denmark in 2023 represented by the following main commodity groups:
- 75% (1.43 billion US$): 890190 - Vessels; n.e.s. in heading no. 8901, for the transport of goods and other vessels for the transport of both persons and goods
- 24% (460 million US$): 890120 - Tankers
- 0.032% (615 thousand US$): 890110 - Cruise ships, excursion boats & sim. vessels princ. designed for the tpt. of persons; ferry-boats of all kinds
The value of imports of commodity group 8901 "Cruise ships, excursion boats, ferry-boats, cargo ships, barges and similar vessels for the transport of persons or goods" to Denmark totalled $ 1.8 billion in 2023. Sales of commodity group 8901 to Denmark went up by 88% compared to 2022: imports of commodity group 8901 "Cruise ships, excursion boats, ferry-boats, cargo ships, barges and similar vessels for the transport of persons or goods" went up by $ 847 million (the value of imports of commodity group 8901 to Denmark was equal to $956 million in 2022)
Imports of commodity group 8901 "Cruise ships, excursion boats, ferry-boats, cargo ships, barges and similar vessels for the transport of persons or goods" accounted for 1.42% of total import flow to Denmark (in 2023, total imports to Denmark amounted to $ 126 billion). The share of commodity group 8901 in total imports to Denmark increased by 0.674 p.p. compared to 2022 (it was 0.753% in 2022 and cumulative imports to Denmark were equal to $ 127 billion).
Imports of commodity group 8901 reached 91% of total imports of group "" to Denmark in 2023 (imports of commodity group to Denmark totalled $1.97 billion in 2023). The share of purchases of commodity group 8901 in total imports of commodity group to Denmark increased by 42 p.p. compared to 2022 (it was 48% in 2022, and imports of commodity group to Denmark accounted for $1.96 billion).
Where does Denmark import Cruise ships, excursion boats, ferry-boats, cargo ships, barges and similar vessels for the transport of persons or goods from?
Top trading partners (import of "Cruise ships, excursion boats, ferry-boats, cargo ships, barges and similar vessels for the transport of persons or goods") of Denmark in 2023:
- Singapore with a share of 45% (817 million US$)
- Hong Kong with a share of 20% (373 million US$)
- Panama with a share of 9.07% (163 million US$)
- Marshall Islands with a share of 5.25% (94 million US$)
- Australia with a share of 5.03% (90 million US$)
- Other Asia, nes with a share of 3.93% (71 million US$)
- Japan with a share of 3.52% (63 million US$)
- Korea with a share of 2.94% (53 million US$)
- Lebanon with a share of 1.52% (27 million US$)
- Malta with a share of 1.23% (22 million US$)
Imports structure of 8901 - Cruise ships, excursion boats, ferry-boats, cargo ships, barges and similar vessels for the transport of persons or goods - to Denmark in 2023 represented by the following main commodity groups:
- 89% (1.6 billion US$): 890190 - Vessels; n.e.s. in heading no. 8901, for the transport of goods and other vessels for the transport of both persons and goods
- 5.8% (104 million US$): 890120 - Tankers
- 5.03% (90 million US$): 890110 - Cruise ships, excursion boats & sim. vessels princ. designed for the tpt. of persons; ferry-boats of all kinds
- 0% (357 US$): 890130 - Refrigerated vessels (excl. of 8901.20)