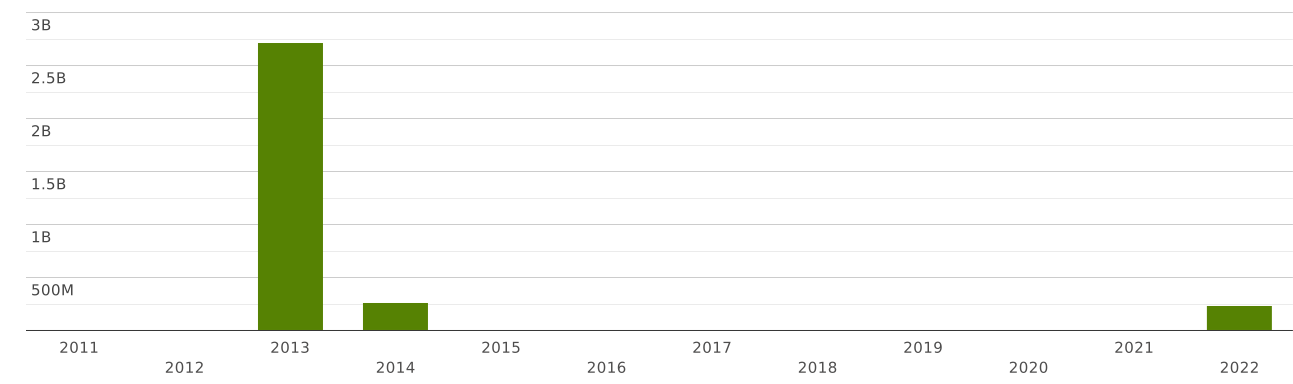
Egypt | Imports and Exports | World | Commodities not specified according to kind | Value (US$) and Value Growth, YoY (%) | 2011 - 2022
The value of exports of commodity group 9999 "Commodities not specified according to kind" from Egypt totalled $ 8.62 million in 2022. Sales of commodity group 9999 from Egypt went up by 6.31 thousand% compared to 2021: exports of commodity group 9999 "Commodities not specified according to kind" went up by $ 8.48 million (cumulative exports of commodity group 9999 from Egypt amounted $134 thousand in 2021)
Exports of commodity group 9999 "Commodities not specified according to kind" amounted to 0.017% of total exports from Egypt (cumulative merchandise exports from Egypt totalled $ 48 billion in 2022). The share of commodity group 9999 in total exports from Egypt increased by 0.017 p.p. compared to 2021 (it was 0% in 2021 and cumulative exports from Egypt were equal to $ 40 billion).
Where does Egypt export Commodities not specified according to kind?
Top export destinations of "Commodities not specified according to kind" from Egypt in 2022:
- Singapore with a share of 67% (5.84 million US$)
- Libya with a share of 9.8% (845 thousand US$)
- Yemen with a share of 4.73% (408 thousand US$)
- State of Palestine with a share of 3.3% (284 thousand US$)
- Jordan with a share of 2.67% (230 thousand US$)
- Sudan with a share of 2.23% (192 thousand US$)
- USA with a share of 2.04% (176 thousand US$)
- Lebanon with a share of 2% (173 thousand US$)
- France with a share of 1.5% (129 thousand US$)
- Bahrain with a share of 1.14% (98 thousand US$)
Exports structure of 9999 - Commodities not specified according to kind - from Egypt in 2022 represented by the following main commodity groups:
- 16.1 thousand% (1.39 billion US$): 999999 - Commodities not specified according to kind
The value of imports of commodity group 9999 "Commodities not specified according to kind" to Egypt totalled $ 234 million in 2022. Sales of commodity group 9999 to Egypt went up by 20 thousand% compared to 2021: imports of commodity group 9999 "Commodities not specified according to kind" went up by $ 233 million (the value of imports of commodity group 9999 to Egypt was equal to $1.13 million in 2021)
Imports of commodity group 9999 "Commodities not specified according to kind" accounted for 0.294% of total import flow to Egypt (in 2022, total imports to Egypt amounted to $ 79 billion). The share of commodity group 9999 in total imports to Egypt increased by 0.293 p.p. compared to 2021 (it was 0.001% in 2021 and cumulative imports to Egypt were equal to $ 73 billion).
Where does Egypt import Commodities not specified according to kind from?
Top trading partners (import of "Commodities not specified according to kind") of Egypt in 2022:
- USA with a share of 41% (96 million US$)
- Germany with a share of 30% (71 million US$)
- France with a share of 12.1% (28 million US$)
- United Kingdom with a share of 7.02% (16.4 million US$)
- Singapore with a share of 4.57% (10.7 million US$)
- Saudi Arabia - 1.94 million US$
- Netherlands - 1.69 million US$
- Canada - 1.48 million US$
- Italy - 1.41 million US$
- Slovak Republic - 1.17 million US$
Imports structure of 9999 - Commodities not specified according to kind - to Egypt in 2022 represented by the following main commodity groups:
- 817% (1.91 billion US$): 999999 - Commodities not specified according to kind