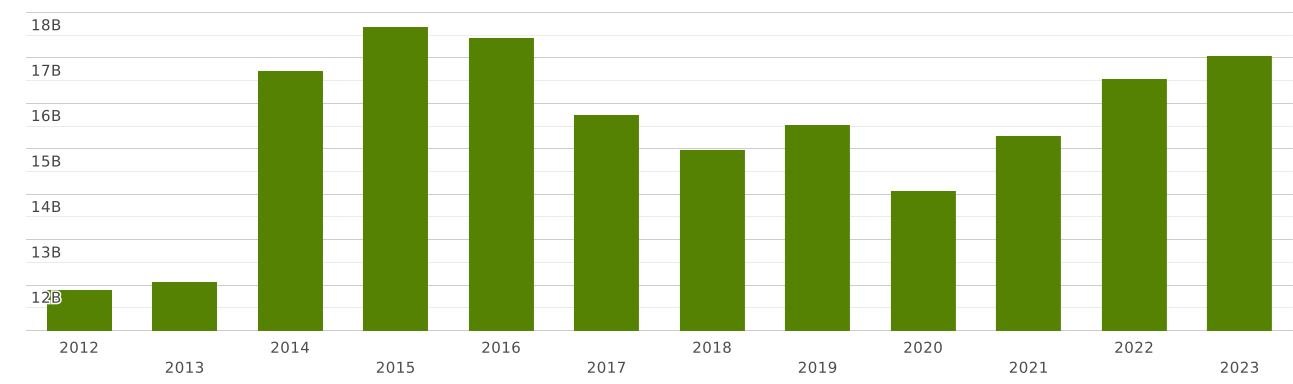
Ethiopia | Imports and Exports | World | ALL COMMODITIES | Value (US$) and Value Growth, YoY (%) | 2012 - 2023
| Commodity | Reporter | Partner | Trade flow | Indicator | 2012 | 2013 | 2014 | 2015 | 2016 | 2017 | 2018 | 2019 | 2020 | 2021 | 2022 | 2023 |
| TOTAL. ALL COMMODITIES | Ethiopia | World | Exports | Value (US$) | 2,891,346,548.00 | 1,866,995,119.13 | 2,312,018,168.30 | 2,023,552,443.10 | 1,988,502,929.81 | 2,305,900,977.61 | 1,548,554,591.71 | 2,683,752,373.01 | 2,533,277,228.80 | 3,057,628,826.59 | 3,085,116,109.03 | 2,859,456,865.95 |
| Value Growth, YoY (%) | 10.57 | -35.42 | 23.83 | -12.47 | -1.73 | 15.96 | -32.84 | 73.30 | -5.60 | 20.69 | 0.89 | -7.31 | ||||
| Imports | Value (US$) | 11,912,931,800.00 | 12,076,122,101.60 | 16,724,467,933.90 | 17,685,578,211.97 | 17,451,145,266.38 | 15,758,882,146.87 | 14,985,595,756.56 | 15,533,415,853.65 | 14,090,449,257.25 | 15,284,934,933.46 | 16,537,801,018.96 | 17,050,150,860.95 | |||
| Value Growth, YoY (%) | 33.90 | 1.36 | 38.49 | 5.74 | -1.32 | -9.69 | -4.90 | 3.65 | -9.28 | 8.47 | 8.19 | 3.09 |
The value of merchandise exports from Ethiopia totalled $ 2.85 billion in 2023. Overall commodity exports from Ethiopia decreased by 7.31% compared to 2022. Merchandise exports decreased by $ 225 million (the value of merchandise exports from Ethiopia amounted to $3.08 billion in 2022)
Ethiopia's exports 2023 by country
Top export destinations of commodities from Ethiopia in 2023:
- Saudi Arabia with a share of 10.4% (297 million US$)
- USA with a share of 9.66% (276 million US$)
- Netherlands with a share of 7.64% (218 million US$)
- United Arab Emirates with a share of 5.73% (163 million US$)
- Somalia with a share of 4.97% (142 million US$)
- India with a share of 4.86% (139 million US$)
- Germany with a share of 4.73% (135 million US$)
- China with a share of 4.6% (131 million US$)
- Korea with a share of 4.06% (116 million US$)
- Japan with a share of 3.64% (104 million US$)
Exports structure from Ethiopia in 2023 represented by the following main commodity groups:
- 43% (1.23 billion US$): 09 - Coffee, tea, matT and spices
- 17.4% (499 million US$): 07 - Edible vegetables and certain roots and tubers
- 14.8% (424 million US$): 12 - Oil seeds and oleaginous fruits; miscellaneous grains, seeds and fruits; industrial or medicinal plants; straw and fodder
- 9.16% (262 million US$): 06 - Live trees and other plants; bulbs, roots and the like; cut flowers and ornamental foliage
- 2.2% (63 million US$): 02 - Meat and edible meat offal
- 2.09% (59 million US$): 61 - Articles of apparel and clothing accessories, knitted or crocheted
- 2.02% (57 million US$): 84 - Nuclear reactors, boilers, machinery and mechanical appliances; parts thereof
- 1.2% (34 million US$): 62 - Articles of apparel and clothing accessories, not knitted or crocheted
- 0.835% (23 million US$): 19 - Preparations of cereals, flour, starch or milk; bakers' wares
- 0.709% (20 million US$): 41 - Raw hides and skins (other than fur skins) and leather
What did Ethiopia export in 2023?
Ethiopia's Top Exports in 2023:
- 42% ($1.22 billion): 0901 - Coffee, whether or not roasted or decaffeinated; coffee husks and skins; coffee substitutes containing coffee in any proportion.
- 9.04% ($258 million): 1207 - Other oil seeds and oleaginous fruits, whether or not broken, n.e.s. in chapter 12
- 9% ($257 million): 0713 - Dried leguminous vegetables, shelled, whether or not skinned or split
- 8.08% ($231 million): 0603 - Cut flowers and flower buds of a kind suitable for bouquets or for ornamental purposes, fresh, dried, dyed, bleached, impregnated or otherwise prepared
- 6.48% ($185 million): 0709 - Other vegetables, fresh or chilled
- 4.55% ($130 million): 1201 - Soya beans, whether or not broken
- 2.14% ($61 million): 0204 - Meat of sheep or goats, fresh, chilled or frozen.
- 1.07% ($30 million): 0602 - Other live plants (including their roots), cuttings and slips; mushroom spawn
- 0.959% ($27 million): 1208 - Flours and meals of oil seeds or oleaginous fruits, other than those of mustard
- 0.788% ($22 million): 1905 - Bread, pastry, cakes, biscuits and other bakers' wares, whether or not containing cocoa; communion wafers, empty cachets of a kind suitable for pharmaceutical use, sealing wafers, rice paper and similar products
The value of merchandise imports to Ethiopia totalled $ 17 billion in 2023. Merchandise imports to Ethiopia increased by 3.09% compared to 2022. Goods imports grew up by $ 512 million in 2023 (the value of merchandise imports to Ethiopia was equal to $16.5 billion in 2022)
Ethiopia's imports 2023 by country
Top trading partners (import sources) of Ethiopia in 2023:
- China with a share of 32% (5.57 billion US$)
- India with a share of 9.6% (1.63 billion US$)
- Kuwait with a share of 7.78% (1.32 billion US$)
- Saudi Arabia with a share of 6.62% (1.12 billion US$)
- USA with a share of 6.33% (1.08 billion US$)
- Morocco with a share of 3.96% (676 million US$)
- Turkey with a share of 3.63% (619 million US$)
- United Arab Emirates with a share of 2.76% (471 million US$)
- Egypt with a share of 2.66% (454 million US$)
- Japan with a share of 2.24% (381 million US$)
Imports structure to Ethiopia in 2023 represented by the following main commodity groups:
- 15.5% (2.65 billion US$): 27 - Mineral fuels, mineral oils and products of their distillation; bituminous substances; mineral waxes
- 11.3% (1.92 billion US$): 84 - Nuclear reactors, boilers, machinery and mechanical appliances; parts thereof
- 7.77% (1.32 billion US$): 85 - Electrical machinery and equipment and parts thereof; sound recorders and reproducers, television image and sound recorders and reproducers, and parts and accessories of such articles
- 7.7% (1.31 billion US$): 87 - Vehicles other than railway or tramway rolling stock, and parts and accessories thereof
- 7.02% (1.19 billion US$): 31 - Fertilizers
- 4.88% (832 million US$): 39 - Plastics and articles thereof
- 4.39% (749 million US$): 15 - Animal, vegetable or microbial fats and oils and their cleavage products; prepared edible fats; animal or vegetable waxes
- 3.96% (676 million US$): 30 - Pharmaceutical products
- 3.94% (672 million US$): 72 - Iron and steel
- 3.37% (576 million US$): 10 - Cereals
What did Ethiopia import in 2023?
Ethiopia's Top Imports in 2023:
- 14.2% ($2.42 billion): 2710 - Petroleum oils and oils from bituminous minerals, not crude; preparations n.e.c. containing by weight 70% or more of petroleum oils or oils from bituminous minerals; these being the basic constituents of the preparations; waste oils
- 4.09% ($697 million): 3105 - Mineral or chemical fertilisers containing two or three of the fertilising elements nitrogen, phosphorus and potassium; other fertilisers; goods of this Chapter in tablets or similar forms or in packages of a gross weight not exceeding 10 kg
- 3.37% ($575 million): 8703 - Motor cars and other motor vehicles principally designed for the transport of persons (other than those of heading 87.02), including station wagons and racing cars
- 2.9% ($495 million): 3102 - Mineral or chemical fertilisers, nitrogenous
- 2.88% ($491 million): 1511 - Palm oil and its fractions, whether or not refined, but not chemically modified
- 2.69% ($460 million): 3004 - Medicaments (excluding goods of heading 30.02, 30.05 or 30.06) consisting of mixed or unmixed products for therapeutic or prophylactic uses, put up in measured doses (including those in the form of transdermal administration systems) or in forms or packings for retail sale
- 2.38% ($406 million): 8411 - Turbo-jets, turbo-propellers and other gas turbines
- 2.27% ($388 million): 8704 - Motor vehicles for the transport of goods
- 2.08% ($355 million): 8807 - Aircraft; parts of goods of heading 8801, 8802 or 8806
- 2.04% ($348 million): 8517 - Electrical apparatus for line telephony or line telegraphy, including line telephone sets with cordless handsets and telecommunication apparatus for carrier-current line systems or for digital line systems; videophones