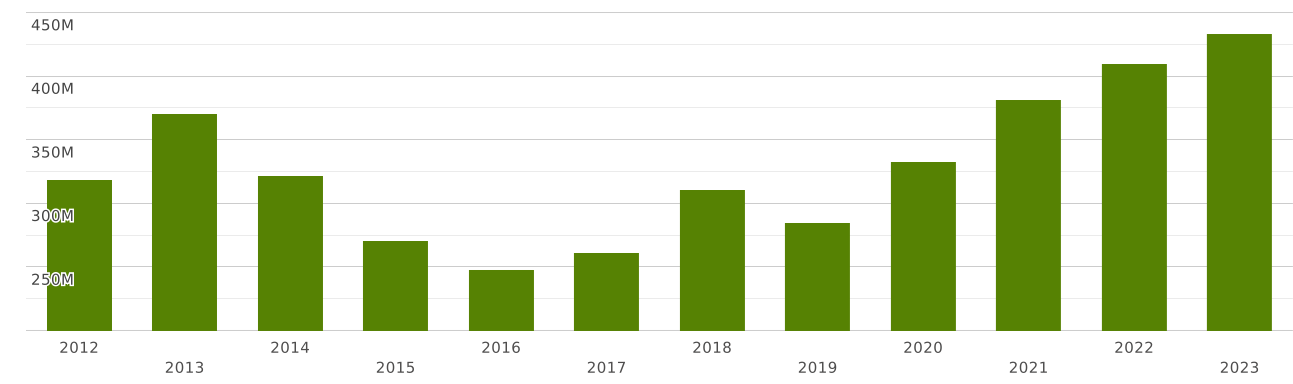
France | Imports and Exports | World | Live animals | Value (US$) and Value Growth, YoY (%) | 2012 - 2023
The value of exports of commodity group 01 "Live animals" from France totalled $ 2.61 billion in 2023. Sales of commodity group 01 from France went up by 1.3% compared to 2022: exports of commodity group 01 "Live animals" went up by $ 33 million (cumulative exports of commodity group 01 from France amounted $2.58 billion in 2022)
Exports of commodity group 01 "Live animals" amounted to 0.409% of total exports from France (cumulative merchandise exports from France totalled $ 640 billion in 2023). The share of commodity group 01 in total exports from France decreased by 0.009 p.p. compared to 2022 (it was 0.418% in 2022 and cumulative exports from France were equal to $ 618 billion).
Where does France export Live animals?
Top export destinations of "Live animals" from France in 2023:
- Italy with a share of 52% (1.37 billion US$)
- Spain with a share of 13.7% (358 million US$)
- Belgium with a share of 8.08% (211 million US$)
- United Kingdom with a share of 4.65% (122 million US$)
- Algeria with a share of 3.58% (93 million US$)
- Germany with a share of 2.67% (70 million US$)
- Ireland with a share of 1.39% (36 million US$)
- Switzerland with a share of 1.27% (33 million US$)
- Netherlands with a share of 1.22% (32 million US$)
- USA with a share of 1.19% (31 million US$)
Exports structure of 01 - Live animals - from France in 2023 represented by the following main commodity groups:
- 66% (1.75 billion US$): 0102 - Live bovine animals
- 12.2% (321 million US$): 0105 - Live poultry, that is to say, fowls of the species Gallus domesticus, ducks, geese, turkeys and guinea fowls
- 10.3% (272 million US$): 0101 - Live horses, asses, mules and hinnies
- 3.8% (99 million US$): 0106 - Other live animals
- 3.22% (84 million US$): 0103 - Live swine
- 2% (52 million US$): 0104 - Live sheep and goats
The value of imports of commodity group 01 "Live animals" to France totalled $ 433 million in 2023. Sales of commodity group 01 to France went up by 5.84% compared to 2022: imports of commodity group 01 "Live animals" went up by $ 23 million (the value of imports of commodity group 01 to France was equal to $409 million in 2022)
Imports of commodity group 01 "Live animals" accounted for 0.055% of total import flow to France (in 2023, total imports to France amounted to $ 777 billion). The share of commodity group 01 in total imports to France increased by 0.005 p.p. compared to 2022 (it was 0.049% in 2022 and cumulative imports to France were equal to $ 819 billion).
Where does France import Live animals from?
Top trading partners (import of "Live animals") of France in 2023:
- United Kingdom with a share of 31% (137 million US$)
- Belgium with a share of 18.3% (79 million US$)
- Spain with a share of 10.8% (46 million US$)
- Ireland with a share of 9.4% (40 million US$)
- Germany with a share of 5.61% (24 million US$)
- Netherlands with a share of 4.68% (20 million US$)
- Vietnam with a share of 4.13% (17.9 million US$)
- USA with a share of 3.21% (13.9 million US$)
- Mauritius with a share of 2.59% (11.2 million US$)
- Italy with a share of 1.37% (5.96 million US$)
Imports structure of 01 - Live animals - to France in 2023 represented by the following main commodity groups:
- 34% (148 million US$): 0101 - Live horses, asses, mules and hinnies
- 21% (94 million US$): 0105 - Live poultry, that is to say, fowls of the species Gallus domesticus, ducks, geese, turkeys and guinea fowls
- 17.8% (77 million US$): 0106 - Other live animals
- 13% (56 million US$): 0102 - Live bovine animals
- 6.97% (30 million US$): 0104 - Live sheep and goats
- 2.99% (13 million US$): 0103 - Live swine