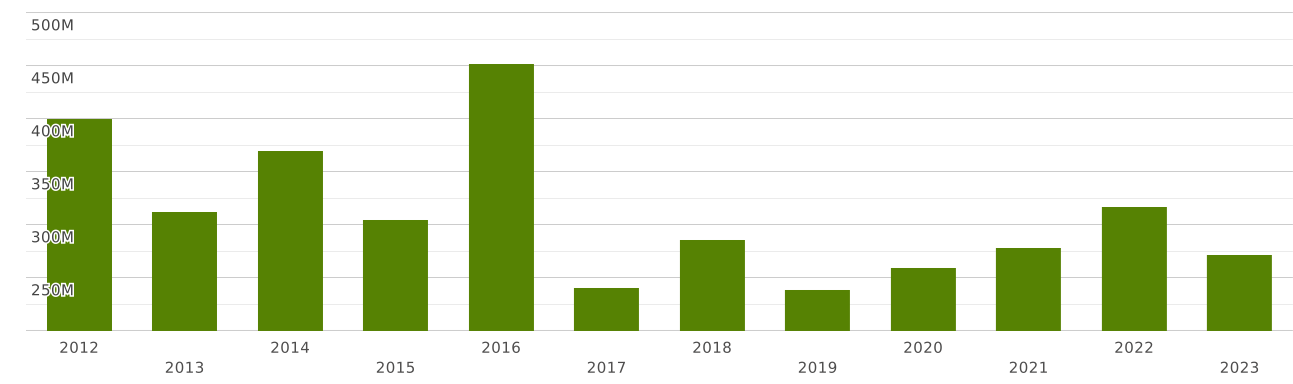
France | Imports and Exports | World | Soya beans (soybeans) | Value (US$) and Value Growth, YoY (%) | 2012 - 2023
The value of exports of commodity group 1201 "Soya beans, whether or not broken" from France totalled $ 86 million in 2023. Sales of commodity group 1201 from France decreased by 14.2% in value terms compared to 2022. exports of commodity group 1201 "Soya beans, whether or not broken" decreased by $ 14.3 million (cumulative exports of commodity group 1201 from France amounted $100 million in 2022)
Exports of commodity group 1201 "Soya beans, whether or not broken" amounted to 0.013% of total exports from France (cumulative merchandise exports from France totalled $ 640 billion in 2023). The share of commodity group 1201 in total exports from France decreased by 0.002 p.p. compared to 2022 (it was 0.016% in 2022 and cumulative exports from France were equal to $ 618 billion).
Exports of commodity group 1201 amounted to 3.23% of total sales of group "" from France in 2023 (the value of exports of commodity group from France amounted to $2.66 billion in 2023). The share of exports of commodity group 1201 in sales of commodity group from France lowered by 0.319 p.p. compared to 2022 (it was 3.55% in 2022, and exports of commodity group from France were $2.82 billion).
Where does France export Soya beans, whether or not broken?
Top export destinations of "Soya beans, whether or not broken" from France in 2023:
- Spain with a share of 28% (24 million US$)
- Belgium with a share of 25% (22 million US$)
- Netherlands with a share of 19.7% (17 million US$)
- Germany with a share of 6.55% (5.65 million US$)
- Italy with a share of 6.37% (5.49 million US$)
- Switzerland with a share of 3.41% (2.94 million US$)
- Russia with a share of 1.71% (1.47 million US$)
- Other Asia, nes with a share of 1.54% (1.33 million US$)
- United Kingdom with a share of 1.45% (1.25 million US$)
- Thailand with a share of 1.01% (874 thousand US$)
Exports structure of 1201 - Soya beans, whether or not broken - from France in 2023 represented by the following main commodity groups:
The value of imports of commodity group 1201 "Soya beans, whether or not broken" to France totalled $ 271 million in 2023. Sales of commodity group 1201 to France decreased by 14.4% in value terms compared to 2022. imports of commodity group 1201 "Soya beans, whether or not broken" decreased by $ 45 million (the value of imports of commodity group 1201 to France was equal to $317 million in 2022)
Imports of commodity group 1201 "Soya beans, whether or not broken" accounted for 0.034% of total import flow to France (in 2023, total imports to France amounted to $ 777 billion). The share of commodity group 1201 in total imports to France decreased by 0.003 p.p. compared to 2022 (it was 0.038% in 2022 and cumulative imports to France were equal to $ 819 billion).
Imports of commodity group 1201 reached 10.6% of total imports of group "" to France in 2023 (imports of commodity group to France totalled $2.55 billion in 2023). The share of purchases of commodity group 1201 in imports of commodity group to France went down by 1.31 p.p. compared to 2022 (it was 11.9% in 2022, and imports of commodity group to France accounted for $2.66 billion).
Where does France import Soya beans, whether or not broken from?
Top trading partners (import of "Soya beans, whether or not broken") of France in 2023:
- Brazil with a share of 53% (146 million US$)
- USA with a share of 12.7% (34 million US$)
- Togo with a share of 12.1% (33 million US$)
- Ukraine with a share of 5.86% (15.9 million US$)
- Canada with a share of 3.53% (9.61 million US$)
- Belgium with a share of 3.21% (8.74 million US$)
- Burkina Faso with a share of 1.4% (3.82 million US$)
- Austria with a share of 1.25% (3.4 million US$)
- Germany with a share of 1.16% (3.15 million US$)
- Uganda with a share of 1.1% (2.99 million US$)
Imports structure of 1201 - Soya beans, whether or not broken - to France in 2023 represented by the following main commodity groups: