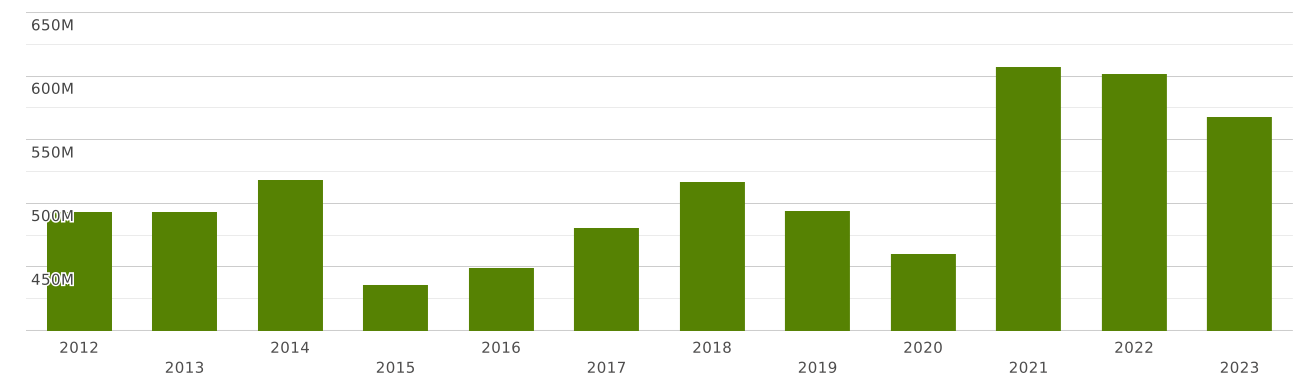
France | Imports and Exports | World | Carpets and other textile floor coverings | Value (US$) and Value Growth, YoY (%) | 2012 - 2023
The value of exports of commodity group 57 "Carpets and other textile floor coverings" from France totalled $ 253 million in 2023. Sales of commodity group 57 from France went up by 1.41% compared to 2022: exports of commodity group 57 "Carpets and other textile floor coverings" went up by $ 3.53 million (cumulative exports of commodity group 57 from France amounted $250 million in 2022)
Exports of commodity group 57 "Carpets and other textile floor coverings" amounted to 0.039% of total exports from France (cumulative merchandise exports from France totalled $ 640 billion in 2023). The share of commodity group 57 in total exports from France decreased by 0 p.p. compared to 2022 (it was 0.04% in 2022 and cumulative exports from France were equal to $ 618 billion).
Where does France export Carpets and other textile floor coverings?
Top export destinations of "Carpets and other textile floor coverings" from France in 2023:
- United Kingdom with a share of 13.2% (33 million US$)
- Germany with a share of 11.6% (29 million US$)
- Spain with a share of 8.59% (21 million US$)
- Switzerland with a share of 7.66% (19.4 million US$)
- Belgium with a share of 7.33% (18.5 million US$)
- Netherlands with a share of 6.9% (17.5 million US$)
- Italy with a share of 6.08% (15.4 million US$)
- Poland with a share of 5.94% (15 million US$)
- USA with a share of 3.01% (7.63 million US$)
- Luxembourg with a share of 2.76% (7.01 million US$)
Exports structure of 57 - Carpets and other textile floor coverings - from France in 2023 represented by the following main commodity groups:
- 55% (140 million US$): 5703 - Carpets and other textile floor coverings, tufted, whether or not made up.
- 14.1% (35 million US$): 5704 - Carpets and other textile floor coverings, of felt, not tufted or flocked, whether or not made up
- 13.7% (34 million US$): 5705 - Other carpets and other textile floor coverings, whether or not made up
- 10.2% (25 million US$): 5702 - Carpets and other textile floor coverings, woven, not tufted or flocked, whether or not made up, including Kelem, Schumacks, Karamanie and similar hand-woven rugs
- 4.82% (12.2 million US$): 5701 - Carpets and other textile floor coverings, knotted, whether or not made up
The value of imports of commodity group 57 "Carpets and other textile floor coverings" to France totalled $ 568 million in 2023. Sales of commodity group 57 to France decreased by 5.6% in value terms compared to 2022. imports of commodity group 57 "Carpets and other textile floor coverings" decreased by $ 33 million (the value of imports of commodity group 57 to France was equal to $601 million in 2022)
Imports of commodity group 57 "Carpets and other textile floor coverings" accounted for 0.073% of total import flow to France (in 2023, total imports to France amounted to $ 777 billion). The share of commodity group 57 in total imports to France decreased by 0 p.p. compared to 2022 (it was 0.073% in 2022 and cumulative imports to France were equal to $ 819 billion).
Where does France import Carpets and other textile floor coverings from?
Top trading partners (import of "Carpets and other textile floor coverings") of France in 2023:
- Belgium with a share of 21% (119 million US$)
- Netherlands with a share of 19.9% (113 million US$)
- China with a share of 8.2% (46 million US$)
- United Kingdom with a share of 6.76% (38 million US$)
- India with a share of 6.44% (36 million US$)
- Germany with a share of 4.99% (28 million US$)
- Turkey with a share of 4.63% (26 million US$)
- Italy with a share of 4.48% (25 million US$)
- Spain with a share of 4.15% (23 million US$)
- Poland with a share of 2.91% (16.5 million US$)
Imports structure of 57 - Carpets and other textile floor coverings - to France in 2023 represented by the following main commodity groups:
- 49% (278 million US$): 5703 - Carpets and other textile floor coverings, tufted, whether or not made up.
- 23% (134 million US$): 5702 - Carpets and other textile floor coverings, woven, not tufted or flocked, whether or not made up, including Kelem, Schumacks, Karamanie and similar hand-woven rugs
- 16% (90 million US$): 5705 - Other carpets and other textile floor coverings, whether or not made up
- 5.62% (31 million US$): 5704 - Carpets and other textile floor coverings, of felt, not tufted or flocked, whether or not made up
- 2.59% (14.7 million US$): 5701 - Carpets and other textile floor coverings, knotted, whether or not made up