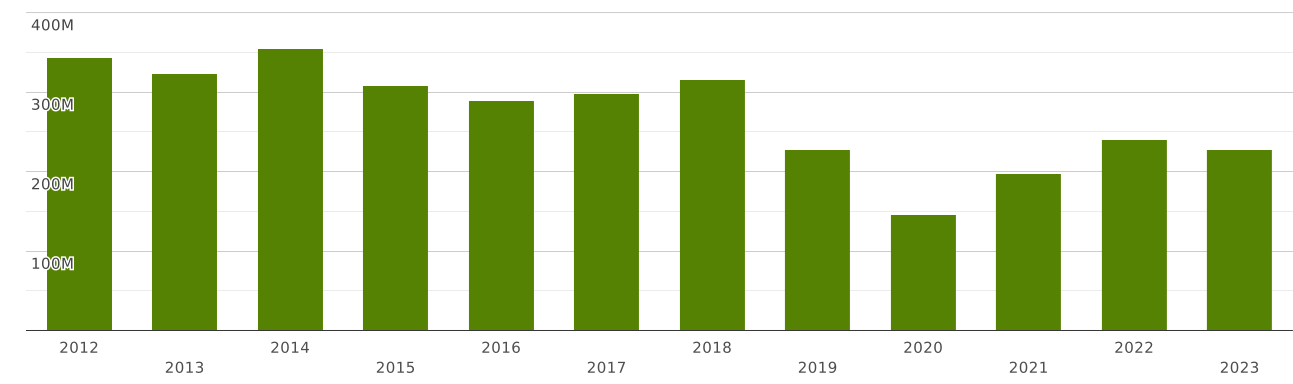
India | Imports and Exports | World | Wool, not carded or combed | Value (US$) and Value Growth, YoY (%) | 2012 - 2023
The value of exports of commodity group 5101 "Wool, not carded or combed" from India totalled $ 545 thousand in 2023. Sales of commodity group 5101 from India went up by 3.53% compared to 2022: exports of commodity group 5101 "Wool, not carded or combed" went up by $ 18.6 thousand (cumulative exports of commodity group 5101 from India amounted $527 thousand in 2022)
Exports of commodity group 5101 amounted to 0.316% of total sales of group "" from India in 2023 (the value of exports of commodity group from India amounted to $172 million in 2023). The share of exports of commodity group 5101 in sales of commodity group from India lowered by 0.005 p.p. compared to 2022 (it was 0.321% in 2022, and exports of commodity group from India were $163 million).
Where does India export Wool, not carded or combed?
Top export destinations of "Wool, not carded or combed" from India in 2023:
- Italy with a share of 46% (254 thousand US$)
- New Zealand with a share of 44% (242 thousand US$)
- Nepal with a share of 5.72% (31 thousand US$)
- Greece with a share of 1.9% (10.3 thousand US$)
- Sweden with a share of 1.15% (6.29 thousand US$)
- Ghana - 69 US$
- United Arab Emirates - 51 US$
- Germany - 2.14 US$
Exports structure of 5101 - Wool, not carded or combed - from India in 2023 represented by the following main commodity groups:
- 88% (483 thousand US$): 510129 - Wool, not carded/combed, degreased, not carbonised, other than shorn
- 11.3% (61 thousand US$): 510119 - Wool, not carded/combed, greasy, incl. fleece-washed wool, other than shorn
- 0.012% (69 US$): 510111 - Wool, not carded/combed, greasy, incl. fleece-washed wool, shorn
The value of imports of commodity group 5101 "Wool, not carded or combed" to India totalled $ 227 million in 2023. Sales of commodity group 5101 to India decreased by 5.38% in value terms compared to 2022. imports of commodity group 5101 "Wool, not carded or combed" decreased by $ 12.9 million (the value of imports of commodity group 5101 to India was equal to $240 million in 2022)
Imports of commodity group 5101 "Wool, not carded or combed" accounted for 0.033% of total import flow to India (in 2023, total imports to India amounted to $ 672 billion). The share of commodity group 5101 in total imports to India increased by 0.001 p.p. compared to 2022 (it was 0.032% in 2022 and cumulative imports to India were equal to $ 732 billion).
Imports of commodity group 5101 reached 71% of total imports of group "" to India in 2023 (imports of commodity group to India totalled $318 million in 2023). The share of purchases of commodity group 5101 in imports of commodity group to India went down by 1.74 p.p. compared to 2022 (it was 73% in 2022, and imports of commodity group to India accounted for $328 million).
Where does India import Wool, not carded or combed from?
Top trading partners (import of "Wool, not carded or combed") of India in 2023:
- Australia with a share of 54% (124 million US$)
- New Zealand with a share of 16.6% (37 million US$)
- China with a share of 5.63% (12.8 million US$)
- Syrian Arab Republic with a share of 4.76% (10.8 million US$)
- Turkey with a share of 3.25% (7.41 million US$)
- United Kingdom with a share of 3.14% (7.16 million US$)
- South Africa with a share of 2.31% (5.27 million US$)
- Uruguay with a share of 1.33% (3.03 million US$)
- Italy with a share of 1.13% (2.59 million US$)
- Tunisia - 1.87 million US$
Imports structure of 5101 - Wool, not carded or combed - to India in 2023 represented by the following main commodity groups:
- 46% (106 million US$): 510111 - Wool, not carded/combed, greasy, incl. fleece-washed wool, shorn
- 27% (63 million US$): 510129 - Wool, not carded/combed, degreased, not carbonised, other than shorn
- 17.9% (40 million US$): 510119 - Wool, not carded/combed, greasy, incl. fleece-washed wool, other than shorn
- 6.79% (15.4 million US$): 510121 - Wool, not carded/combed, degreased, not carbonised, shorn
- 0.435% (991 thousand US$): 510130 - Wool, not carded/combed, carbonised