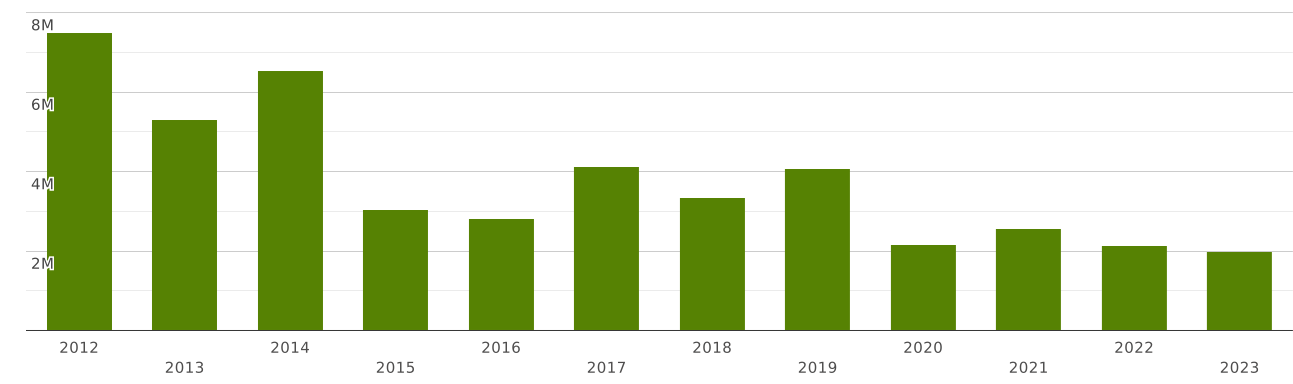
Indonesia | Imports and Exports | World | Silica sands & quartz sands, whether or not coloured | Value (US$) and Value Growth, YoY (%) | 2012 - 2023
The value of exports of commodity group 250510 "Silica sands & quartz sands, whether or not coloured" from Indonesia totalled $ 58 million in 2023. Sales of commodity group 250510 from Indonesia went up by 298% compared to 2022: exports of commodity group 250510 "Silica sands & quartz sands, whether or not coloured" went up by $ 43 million (cumulative exports of commodity group 250510 from Indonesia amounted $14.6 million in 2022)
Exports of commodity group 250510 "Silica sands & quartz sands, whether or not coloured" amounted to 0.022% of total exports from Indonesia (cumulative merchandise exports from Indonesia totalled $ 258 billion in 2023). The share of commodity group 250510 in total exports from Indonesia increased by 0.017 p.p. compared to 2022 (it was 0.005% in 2022 and cumulative exports from Indonesia were equal to $ 291 billion).
Exports of commodity group 250510 amounted to 10.3% of total sales of group "" from Indonesia in 2023 (the value of exports of commodity group from Indonesia amounted to $563 million in 2023). The share of exports of commodity group 250510 in sales of commodity group from Indonesia increased by 7.36 p.p. compared to 2022 (it was 3.02% in 2022, and exports of commodity group from Indonesia were $485 million).
Exports of commodity group 250510 amounted to 99 percent of total sales of group "" from Indonesia in 2023 (the value of exports of commodity group from Indonesia amounted to 58 million USD in 2023). The share of exports of commodity group 250510 in sales of commodity group from Indonesia lowered by 0 p.p. compared to 2022 (it was 100 percent in 2022, and exports of commodity group from Indonesia amounted to 14.6 million USD).
Where does Indonesia export Silica sands & quartz sands, whether or not coloured?
Top export destinations of "Silica sands & quartz sands, whether or not coloured" from Indonesia in 2023:
- China with a share of 99% (58 million US$)
- Australia - 0.7 US$
The value of imports of commodity group 250510 "Silica sands & quartz sands, whether or not coloured" to Indonesia totalled $ 1.99 million in 2023. Sales of commodity group 250510 to Indonesia decreased by 6.31% in value terms compared to 2022. imports of commodity group 250510 "Silica sands & quartz sands, whether or not coloured" decreased by $ 134 thousand (the value of imports of commodity group 250510 to Indonesia was equal to $2.13 million in 2022)
Imports of commodity group 250510 reached 0.151% of total imports of group "" to Indonesia in 2023 (imports of commodity group to Indonesia totalled $1.31 billion in 2023). The share of purchases of commodity group 250510 in total imports of commodity group to Indonesia increased by 0.026 p.p. compared to 2022 (it was 0.125% in 2022, and imports of commodity group to Indonesia accounted for $1.69 billion).
Imports of commodity group 250510 reached 46 percent of total imports of group "" to Indonesia in 2023 (imports of commodity group to Indonesia totalled 4.31 million USD in 2023). The share of purchases of commodity group 250510 in imports of commodity group to Indonesia went down by 0.369 p.p. compared to 2022 (it was 46 percent in 2022, and imports of commodity group to Indonesia accounted for 4.57 million USD).
Where does Indonesia import Silica sands & quartz sands, whether or not coloured from?
Top trading partners (import of "Silica sands & quartz sands, whether or not coloured") of Indonesia in 2023:
- China with a share of 29% (594 thousand US$)
- USA with a share of 24% (489 thousand US$)
- Australia with a share of 14.3% (287 thousand US$)
- Japan with a share of 10.7% (214 thousand US$)
- Saudi Arabia with a share of 4.91% (98 thousand US$)
- Germany with a share of 3.99% (79 thousand US$)
- Other Asia, nes with a share of 3.07% (61 thousand US$)
- Egypt with a share of 2.61% (52 thousand US$)
- Malaysia with a share of 1.8% (35 thousand US$)
- Thailand with a share of 1.21% (24 thousand US$)