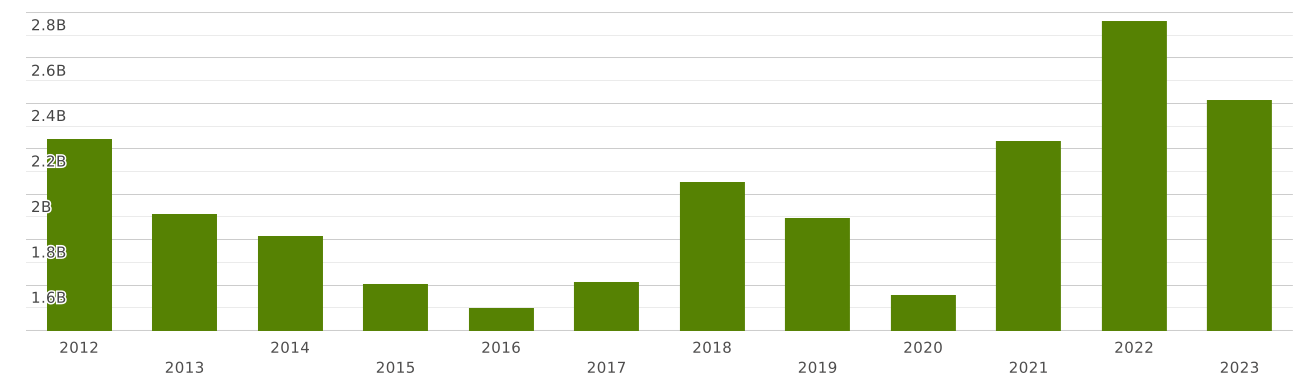
Indonesia | Imports and Exports | World | Inorganic chemicals; organic or inorganic compounds of precious metals, of rare-earth metals, of radioactive elements or of isotopes | Value (US$) and Value Growth, YoY (%) | 2012 - 2023
The value of exports of commodity group 28 "Inorganic chemicals; organic or inorganic compounds of precious metals, of rare earth metals, of radioactive elements or of isotopes" from Indonesia totalled $ 2.06 billion in 2023. Sales of commodity group 28 from Indonesia decreased by 25% in value terms compared to 2022. exports of commodity group 28 "Inorganic chemicals; organic or inorganic compounds of precious metals, of rare earth metals, of radioactive elements or of isotopes" decreased by $ 694 million (cumulative exports of commodity group 28 from Indonesia amounted $2.75 billion in 2022)
Exports of commodity group 28 "Inorganic chemicals; organic or inorganic compounds of precious metals, of rare earth metals, of radioactive elements or of isotopes" amounted to 0.797% of total exports from Indonesia (cumulative merchandise exports from Indonesia totalled $ 258 billion in 2023). The share of commodity group 28 in total exports from Indonesia decreased by 0.147 p.p. compared to 2022 (it was 0.944% in 2022 and cumulative exports from Indonesia were equal to $ 291 billion).
Where does Indonesia export Inorganic chemicals; organic or inorganic compounds of precious metals, of rare earth metals, of radioactive elements or of isotopes?
Top export destinations of "Inorganic chemicals; organic or inorganic compounds of precious metals, of rare earth metals, of radioactive elements or of isotopes" from Indonesia in 2023:
- China with a share of 26% (546 million US$)
- India with a share of 25% (520 million US$)
- Korea with a share of 12.5% (258 million US$)
- Malaysia with a share of 8.27% (170 million US$)
- Other Asia, nes with a share of 5.71% (117 million US$)
- Japan with a share of 4.43% (91 million US$)
- Australia with a share of 3.25% (67 million US$)
- Netherlands with a share of 2.98% (61 million US$)
- Thailand with a share of 1.95% (40 million US$)
- Vietnam with a share of 1.88% (38 million US$)
Exports structure of 28 - Inorganic chemicals; organic or inorganic compounds of precious metals, of rare earth metals, of radioactive elements or of isotopes - from Indonesia in 2023 represented by the following main commodity groups:
- 39% (806 million US$): 2818 - Artificial corundum, whether or not chemically defined; aluminium oxide; aluminium hydroxide
- 37% (779 million US$): 2814 - Ammonia, anhydrous or in aqueous solution.
- 12.9% (266 million US$): 2833 - Sulphates; alums; peroxosulphates (persulphates)
- 1.67% (34 million US$): 2817 - Zinc oxide; zinc peroxide
- 1.5% (31 million US$): 2809 - Diphosphorus pentaoxide; phosphoric acid; polyphosphoric acids, whether or not chemically defined
- 1.41% (29 million US$): 2811 - Inorganic acids and other inorganic oxygen compounds of non-metals; n.e.s. in heading no. 2806 to 2810
- 1.26% (26 million US$): 2803 - Carbon (carbon blacks and other forms of carbon not elsewhere specified or included)
- 0.873% (18 million US$): 2815 - Sodium hydroxide (caustic soda); potassium hydroxide (caustic potash); peroxides of sodium or potassium
- 0.796% (16.4 million US$): 2843 - Colloidal precious metals; inorganic or organic compounds of precious metals, whether or not chemically defined; amalgams of precious metals.
- 0.659% (13.6 million US$): 2847 - Hydrogen peroxide, whether or not solidified with urea
The value of imports of commodity group 28 "Inorganic chemicals; organic or inorganic compounds of precious metals, of rare earth metals, of radioactive elements or of isotopes" to Indonesia totalled $ 2.41 billion in 2023. Sales of commodity group 28 to Indonesia decreased by 12.5% in value terms compared to 2022. imports of commodity group 28 "Inorganic chemicals; organic or inorganic compounds of precious metals, of rare earth metals, of radioactive elements or of isotopes" decreased by $ 346 million (the value of imports of commodity group 28 to Indonesia was equal to $2.76 billion in 2022)
Imports of commodity group 28 "Inorganic chemicals; organic or inorganic compounds of precious metals, of rare earth metals, of radioactive elements or of isotopes" accounted for 1.08% of total import flow to Indonesia (in 2023, total imports to Indonesia amounted to $ 221 billion). The share of commodity group 28 in total imports to Indonesia decreased by 0.074 p.p. compared to 2022 (it was 1.16% in 2022 and cumulative imports to Indonesia were equal to $ 237 billion).
Where does Indonesia import Inorganic chemicals; organic or inorganic compounds of precious metals, of rare earth metals, of radioactive elements or of isotopes from?
Top trading partners (import of "Inorganic chemicals; organic or inorganic compounds of precious metals, of rare earth metals, of radioactive elements or of isotopes") of Indonesia in 2023:
- China with a share of 36% (880 million US$)
- Japan with a share of 11.1% (269 million US$)
- USA with a share of 10.5% (254 million US$)
- Korea with a share of 9.5% (229 million US$)
- Australia with a share of 7.48% (180 million US$)
- Vietnam with a share of 5.38% (130 million US$)
- India with a share of 3.43% (82 million US$)
- Thailand with a share of 3.2% (77 million US$)
- Other Asia, nes with a share of 2.63% (63 million US$)
- Turkey with a share of 2.51% (60 million US$)
Imports structure of 28 - Inorganic chemicals; organic or inorganic compounds of precious metals, of rare earth metals, of radioactive elements or of isotopes - to Indonesia in 2023 represented by the following main commodity groups:
- 15.7% (381 million US$): 2836 - Carbonates; peroxocarbonates (percarbonates); commercial ammonium carbonate containing ammonium carbamate.
- 13% (315 million US$): 2803 - Carbon (carbon blacks and other forms of carbon not elsewhere specified or included)
- 12.4% (300 million US$): 2818 - Artificial corundum, whether or not chemically defined; aluminium oxide; aluminium hydroxide
- 10.6% (257 million US$): 2815 - Sodium hydroxide (caustic soda); potassium hydroxide (caustic potash); peroxides of sodium or potassium
- 5.37% (129 million US$): 2835 - Phosphinates (hypophosphites), phosphonates (phosphites) and phosphates; polyphosphates, whether or not chemically defined
- 4.19% (101 million US$): 2811 - Inorganic acids and other inorganic oxygen compounds of non-metals; n.e.s. in heading no. 2806 to 2810
- 3.87% (93 million US$): 2843 - Colloidal precious metals; inorganic or organic compounds of precious metals, whether or not chemically defined; amalgams of precious metals.
- 3.75% (90 million US$): 2833 - Sulphates; alums; peroxosulphates (persulphates)
- 3.36% (81 million US$): 2804 - Hydrogen, rare gases and other non-metals
- 2.79% (67 million US$): 2827 - Chlorides, chloride oxides and chloride hydroxides; bromides and bromide oxides; iodides and iodide oxides.