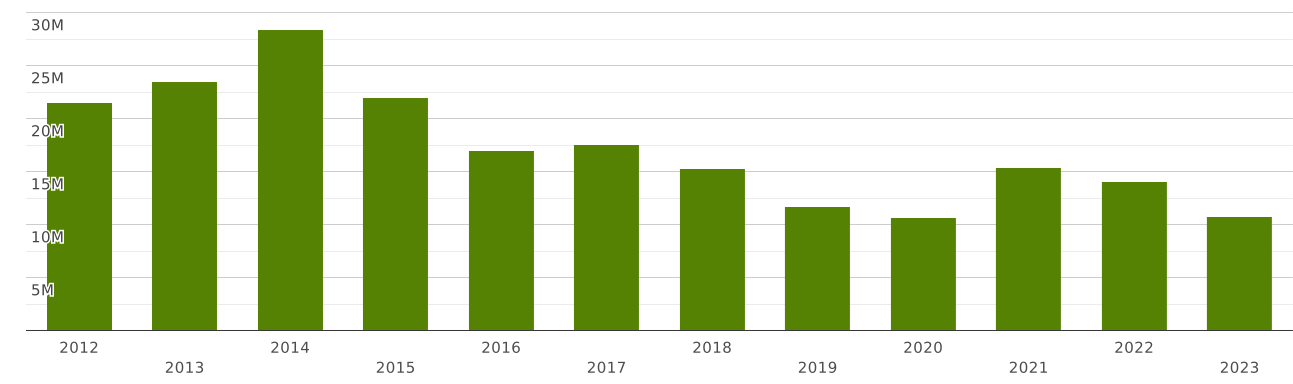
Indonesia | Imports and Exports | World | Rosin and resin acids | Value (US$) and Value Growth, YoY (%) | 2012 - 2023
| Commodity | Reporter | Partner | Trade flow | Indicator | 2012 | 2013 | 2014 | 2015 | 2016 | 2017 | 2018 | 2019 | 2020 | 2021 | 2022 | 2023 |
| 3806. Rosin and resin acids, and derivatives thereof; rosin spirit and rosin oils; run gums. | Indonesia | World | Exports | Value (US$) | 98,130,559.00 | 106,744,557.00 | 108,995,983.00 | 115,691,925.00 | 101,747,499.00 | 97,508,591.46 | 98,541,388.12 | 84,553,437.54 | 83,655,064.63 | 124,170,884.15 | 138,186,107.00 | 140,510,341.23 |
| Value Growth, YoY (%) | 5.42 | 8.77 | 2.10 | 6.14 | -12.05 | -4.16 | 1.05 | -14.19 | -1.06 | 48.43 | 11.28 | 1.68 | ||||
| Imports | Value (US$) | 21,538,601.00 | 23,513,172.00 | 28,389,792.00 | 21,980,873.00 | 16,969,396.00 | 17,556,602.00 | 15,295,261.00 | 11,717,381.00 | 10,683,682.00 | 15,418,813.00 | 14,040,412.00 | 10,741,187.00 | |||
| Value Growth, YoY (%) | -21.82 | 9.16 | 20.73 | -22.57 | -22.79 | 3.46 | -12.88 | -23.39 | -8.82 | 44.32 | -8.93 | -23.49 |
The value of exports of commodity group 3806 "Rosin and resin acids, and derivatives thereof; rosin spirit and rosin oils; run gums." from Indonesia totalled $ 140 million in 2023. Sales of commodity group 3806 from Indonesia went up by 1.68% compared to 2022: exports of commodity group 3806 "Rosin and resin acids, and derivatives thereof; rosin spirit and rosin oils; run gums." went up by $ 2.32 million (cumulative exports of commodity group 3806 from Indonesia amounted $138 million in 2022)
Exports of commodity group 3806 "Rosin and resin acids, and derivatives thereof; rosin spirit and rosin oils; run gums." amounted to 0.054% of total exports from Indonesia (cumulative merchandise exports from Indonesia totalled $ 258 billion in 2023). The share of commodity group 3806 in total exports from Indonesia increased by 0.006 p.p. compared to 2022 (it was 0.047% in 2022 and cumulative exports from Indonesia were equal to $ 291 billion).
Exports of commodity group 3806 amounted to 2.24% of total sales of group "" from Indonesia in 2023 (the value of exports of commodity group from Indonesia amounted to $6.25 billion in 2023). The share of exports of commodity group 3806 in sales of commodity group from Indonesia increased by 0.628 p.p. compared to 2022 (it was 1.61% in 2022, and exports of commodity group from Indonesia were $8.53 billion).
Where does Indonesia export Rosin and resin acids, and derivatives thereof; rosin spirit and rosin oils; run gums.?
Top export destinations of "Rosin and resin acids, and derivatives thereof; rosin spirit and rosin oils; run gums." from Indonesia in 2023:
- China with a share of 43% (61 million US$)
- India with a share of 25% (36 million US$)
- Japan with a share of 7.32% (10.2 million US$)
- Pakistan with a share of 3.01% (4.23 million US$)
- Other Asia, nes with a share of 2.69% (3.78 million US$)
- Korea with a share of 2.3% (3.23 million US$)
- Netherlands with a share of 2.14% (3.01 million US$)
- Philippines with a share of 1.22% (1.71 million US$)
- Vietnam with a share of 1.1% (1.55 million US$)
- USA - 1.37 million US$
Exports structure of 3806 - Rosin and resin acids, and derivatives thereof; rosin spirit and rosin oils; run gums. - from Indonesia in 2023 represented by the following main commodity groups:
- 98% (138 million US$): 380610 - Rosin & resin acids
- 0.95% (1.33 million US$): 380620 - Salts of rosin/resin acids/derivatives of rosin/resin acids (excl. salts of rosin adducts)
- 0.443% (623 thousand US$): 380630 - Ester gums
- 0.122% (172 thousand US$): 380690 - Derivatives of rosin/resin acids (excl. of 3806); rosin spirit & rosin oils; run gums
The value of imports of commodity group 3806 "Rosin and resin acids, and derivatives thereof; rosin spirit and rosin oils; run gums." to Indonesia totalled $ 10.7 million in 2023. Sales of commodity group 3806 to Indonesia decreased by 23% in value terms compared to 2022. imports of commodity group 3806 "Rosin and resin acids, and derivatives thereof; rosin spirit and rosin oils; run gums." decreased by $ 3.29 million (the value of imports of commodity group 3806 to Indonesia was equal to $14 million in 2022)
Imports of commodity group 3806 "Rosin and resin acids, and derivatives thereof; rosin spirit and rosin oils; run gums." accounted for 0.004% of total import flow to Indonesia (in 2023, total imports to Indonesia amounted to $ 221 billion). The share of commodity group 3806 in total imports to Indonesia decreased by 0.001 p.p. compared to 2022 (it was 0.005% in 2022 and cumulative imports to Indonesia were equal to $ 237 billion).
Imports of commodity group 3806 reached 0.321% of total imports of group "" to Indonesia in 2023 (imports of commodity group to Indonesia totalled $3.33 billion in 2023). The share of purchases of commodity group 3806 in imports of commodity group to Indonesia went down by 0.034 p.p. compared to 2022 (it was 0.356% in 2022, and imports of commodity group to Indonesia accounted for $3.94 billion).
Where does Indonesia import Rosin and resin acids, and derivatives thereof; rosin spirit and rosin oils; run gums. from?
Top trading partners (import of "Rosin and resin acids, and derivatives thereof; rosin spirit and rosin oils; run gums.") of Indonesia in 2023:
- China with a share of 58% (6.26 million US$)
- Other Asia, nes with a share of 10.5% (1.13 million US$)
- Japan with a share of 8.13% (873 thousand US$)
- USA with a share of 6.26% (672 thousand US$)
- Portugal with a share of 4.72% (507 thousand US$)
- France with a share of 4.68% (503 thousand US$)
- Ireland with a share of 2.51% (270 thousand US$)
- Brazil with a share of 2.12% (228 thousand US$)
- Vietnam - 57 thousand US$
- Netherlands - 37 thousand US$
Imports structure of 3806 - Rosin and resin acids, and derivatives thereof; rosin spirit and rosin oils; run gums. - to Indonesia in 2023 represented by the following main commodity groups:
- 49% (5.32 million US$): 380690 - Derivatives of rosin/resin acids (excl. of 3806); rosin spirit & rosin oils; run gums
- 35% (3.76 million US$): 380630 - Ester gums
- 12.9% (1.39 million US$): 380610 - Rosin & resin acids
- 2.38% (255 thousand US$): 380620 - Salts of rosin/resin acids/derivatives of rosin/resin acids (excl. salts of rosin adducts)