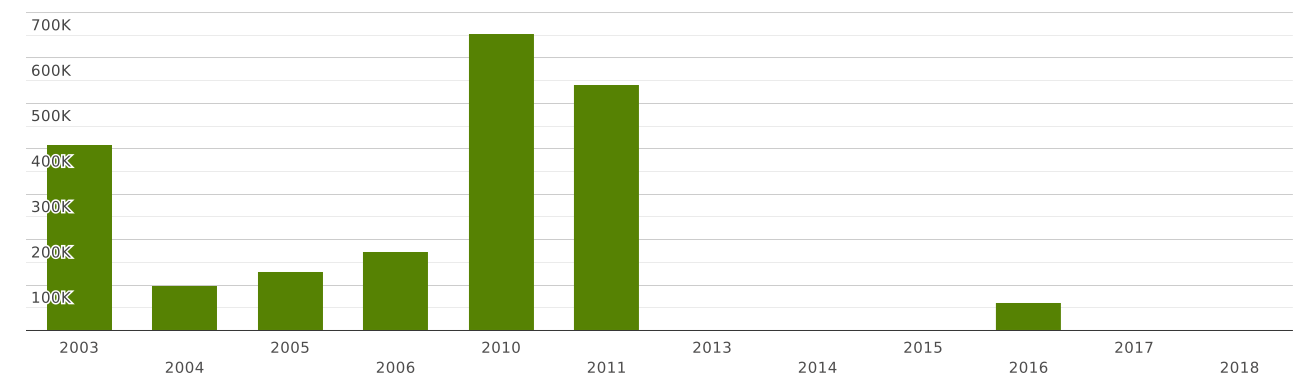
Iran | Imports and Exports | World | Cheese, curd | Value (US$) and Value Growth, YoY (%) | 2003 - 2018
| Commodity | Reporter | Partner | Trade flow | Indicator | 2003 | 2004 | 2005 | 2006 | 2010 | 2011 | 2013 | 2014 | 2015 | 2016 | 2017 | 2018 |
| 0406. Cheese and curd | Iran | World | Exports | Value (US$) | 973,979.00 | 732,200.00 | 4,052,220.00 | 29,070,509.00 | 69,386,128.00 | 111,353,772.00 | 127,846,259.54 | 155,649,695.85 | 156,384,856.00 | 187,120,931.34 | 196,016,549.00 | 198,305,674.00 |
| Value Growth, YoY (%) | -24.82 | 453.43 | 617.39 | 60.48 | 21.74 | 0.47 | 19.65 | 4.75 | 1.16 | |||||||
| Imports | Value (US$) | 408,551.00 | 98,163.00 | 129,733.00 | 173,702.00 | 653,820.00 | 542,519.00 | 466.56 | 62,420.00 | |||||||
| Value Growth, YoY (%) | -75.97 | 32.16 | 33.89 | -17.02 |
The value of exports of commodity group 0406 "Cheese and curd" from Iran totalled $ 198 million in 2018. Sales of commodity group 0406 from Iran went up by 1.16% compared to 2017: exports of commodity group 0406 "Cheese and curd" went up by $ 2.28 million (cumulative exports of commodity group 0406 from Iran amounted $196 million in 2017)
Exports of commodity group 0406 "Cheese and curd" amounted to 0.205% of total exports from Iran (cumulative merchandise exports from Iran totalled $ 96 billion in 2018). The share of commodity group 0406 in total exports from Iran increased by 0.02 p.p. compared to 2017 (it was 0.185% in 2017 and cumulative exports from Iran were equal to $ 105 billion).
Exports of commodity group 0406 amounted to 32% of total sales of group "" from Iran in 2018 (the value of exports of commodity group from Iran amounted to $615 million in 2018). The share of exports of commodity group 0406 in sales of commodity group from Iran increased by 4.57 p.p. compared to 2017 (it was 27% in 2017, and exports of commodity group from Iran were $709 million).
Where does Iran export Cheese and curd?
Top export destinations of "Cheese and curd" from Iran in 2018:
- Iraq with a share of 83% (164 million US$)
- Afghanistan with a share of 11.9% (23 million US$)
- Russia with a share of 1.92% (3.82 million US$)
- Pakistan - 1.89 million US$
- Turkmenistan - 1.04 million US$
- Azerbaijan - 908 thousand US$
- Kazakhstan - 717 thousand US$
- United Arab Emirates - 272 thousand US$
- Bahrain - 171 thousand US$
- Netherlands - 170 thousand US$
Exports structure of 0406 - Cheese and curd - from Iran in 2018 represented by the following main commodity groups:
- 83% (165 million US$): 040690 - Cheese (not grated, powdered or processed), n.e.s. in heading no. 0406
- 13.3% (26 million US$): 040610 - Fresh (unripened/uncured) cheese, incl. whey cheese, & curd
- 3.35% (6.65 million US$): 040620 - Grated/powdered cheese, of all kinds
Where does Iran import Cheese and curd from?
Top trading partners (import of "Cheese and curd") of Iran in 2018:
Imports structure of 0406 - Cheese and curd - to Iran in 2018 represented by the following main commodity groups: