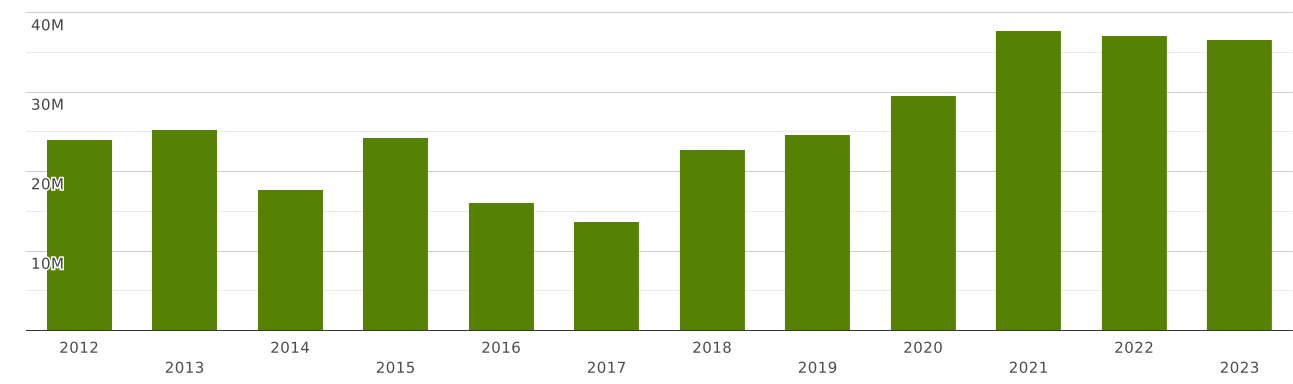
Jordan | Imports and Exports | World | Fish, frozen | Value (US$) and Value Growth, YoY (%) | 2012 - 2023
The value of exports of commodity group 0303 "Fish, frozen, excluding fish fillets and other fish meat of heading 03.04." from Jordan totalled $ 662 thousand in 2023. Sales of commodity group 0303 from Jordan decreased by 62% in value terms compared to 2022. exports of commodity group 0303 "Fish, frozen, excluding fish fillets and other fish meat of heading 03.04." decreased by $ 1.1 million (cumulative exports of commodity group 0303 from Jordan amounted $1.76 million in 2022)
Exports of commodity group 0303 "Fish, frozen, excluding fish fillets and other fish meat of heading 03.04." amounted to 0.005% of total exports from Jordan (cumulative merchandise exports from Jordan totalled $ 12.5 billion in 2023). The share of commodity group 0303 in total exports from Jordan decreased by 0.008 p.p. compared to 2022 (it was 0.014% in 2022 and cumulative exports from Jordan were equal to $ 12.3 billion).
Exports of commodity group 0303 amounted to 56% of total sales of group "" from Jordan in 2023 (the value of exports of commodity group from Jordan amounted to $1.17 million in 2023). The share of exports of commodity group 0303 in sales of commodity group from Jordan lowered by 26 p.p. compared to 2022 (it was 83% in 2022, and exports of commodity group from Jordan were $2.12 million).
Where does Jordan export Fish, frozen, excluding fish fillets and other fish meat of heading 03.04.?
Top export destinations of "Fish, frozen, excluding fish fillets and other fish meat of heading 03.04." from Jordan in 2023:
- Saudi Arabia with a share of 46% (306 thousand US$)
- Free Zones with a share of 40% (264 thousand US$)
- Qatar with a share of 9.53% (63 thousand US$)
- United Arab Emirates with a share of 4.21% (27 thousand US$)
Exports structure of 0303 - Fish, frozen, excluding fish fillets and other fish meat of heading 03.04. - from Jordan in 2023 represented by the following main commodity groups:
The value of imports of commodity group 0303 "Fish, frozen, excluding fish fillets and other fish meat of heading 03.04." to Jordan totalled $ 36 million in 2023. Sales of commodity group 0303 to Jordan decreased by 1.04% in value terms compared to 2022. imports of commodity group 0303 "Fish, frozen, excluding fish fillets and other fish meat of heading 03.04." decreased by $ 386 thousand (the value of imports of commodity group 0303 to Jordan was equal to $37 million in 2022)
Imports of commodity group 0303 "Fish, frozen, excluding fish fillets and other fish meat of heading 03.04." accounted for 0.142% of total import flow to Jordan (in 2023, total imports to Jordan amounted to $ 25 billion). The share of commodity group 0303 in total imports to Jordan increased by 0.006 p.p. compared to 2022 (it was 0.135% in 2022 and cumulative imports to Jordan were equal to $ 27 billion).
Imports of commodity group 0303 reached 48% of total imports of group "" to Jordan in 2023 (imports of commodity group to Jordan totalled $76 million in 2023). The share of purchases of commodity group 0303 in total imports of commodity group to Jordan increased by 1.48 p.p. compared to 2022 (it was 46% in 2022, and imports of commodity group to Jordan accounted for $79 million).
Where does Jordan import Fish, frozen, excluding fish fillets and other fish meat of heading 03.04. from?
Top trading partners (import of "Fish, frozen, excluding fish fillets and other fish meat of heading 03.04.") of Jordan in 2023:
- Turkey with a share of 27% (10 million US$)
- Argentina with a share of 23% (8.46 million US$)
- Spain with a share of 17.6% (6.46 million US$)
- Aruba with a share of 7.26% (2.66 million US$)
- Norway with a share of 6.4% (2.34 million US$)
- China with a share of 4.67% (1.71 million US$)
- Somalia with a share of 2.24% (823 thousand US$)
- Oman with a share of 1.68% (616 thousand US$)
- Vietnam with a share of 1.55% (570 thousand US$)
- Myanmar with a share of 1% (367 thousand US$)
Imports structure of 0303 - Fish, frozen, excluding fish fillets and other fish meat of heading 03.04. - to Jordan in 2023 represented by the following main commodity groups:
- 0.154% (56 thousand US$): 030342 - Yellowfin tunas (Thunnus albacares), frozen (excl. fillets/other fish meat of 03.04/livers & roes)
- 0.019% (6.99 thousand US$): 030329 - Salmonidae (excluding fillets, fish meat of 0304, and edible fish offal of subheadings 0303.91 to 0303.99), frozen (excl. fillets/other fish meat of 03.04/livers & roes)