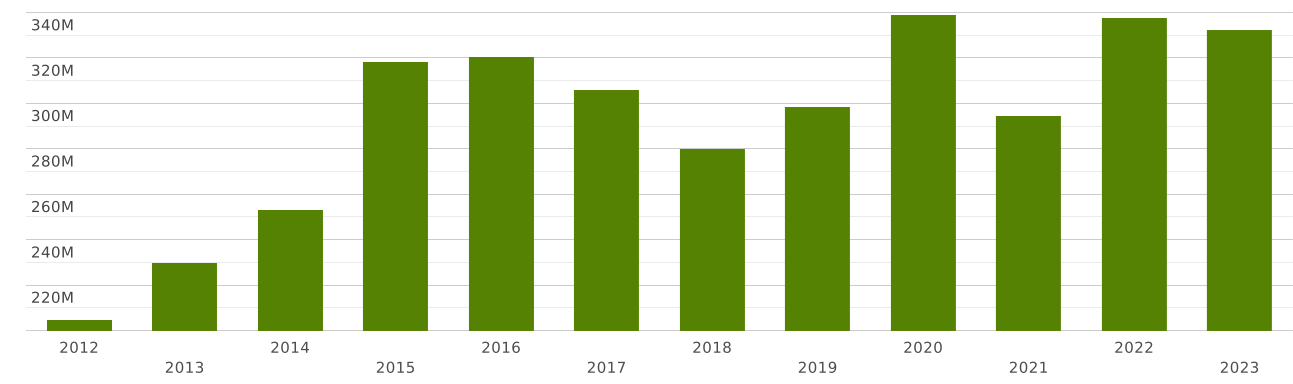
Jordan | Imports and Exports | World | Edible fruit and nuts; peel of citrus fruit or melons | Value (US$) and Value Growth, YoY (%) | 2012 - 2023
The value of exports of commodity group 08 "Edible fruit and nuts; peel of citrus fruit or melons" from Jordan totalled $ 241 million in 2023. Sales of commodity group 08 from Jordan went up by 35% compared to 2022: exports of commodity group 08 "Edible fruit and nuts; peel of citrus fruit or melons" went up by $ 62 million (cumulative exports of commodity group 08 from Jordan amounted $178 million in 2022)
Exports of commodity group 08 "Edible fruit and nuts; peel of citrus fruit or melons" amounted to 1.91% of total exports from Jordan (cumulative merchandise exports from Jordan totalled $ 12.5 billion in 2023). The share of commodity group 08 in total exports from Jordan increased by 0.474 p.p. compared to 2022 (it was 1.44% in 2022 and cumulative exports from Jordan were equal to $ 12.3 billion).
Exports of commodity group 08 amounted to 99% of total sales of group 08 "Edible fruit and nuts; peel of citrus fruit or melons" from Jordan in 2023 (the value of exports of commodity group 08 from Jordan amounted to $241 million in 2023). The share of exports of commodity group 08 in sales of commodity group 08 from Jordan lowered by -0 p.p. compared to 2022 (it was 99% in 2022, and exports of commodity group 08 from Jordan were $178 million).
Where does Jordan export Edible fruit and nuts; peel of citrus fruit or melons?
Top export destinations of "Edible fruit and nuts; peel of citrus fruit or melons" from Jordan in 2023:
- Saudi Arabia with a share of 31% (76 million US$)
- United Arab Emirates with a share of 13.1% (31 million US$)
- Kuwait with a share of 10.5% (25 million US$)
- Iraq with a share of 8.59% (20 million US$)
- Qatar with a share of 8.3% (20 million US$)
- Oman with a share of 6.31% (15.2 million US$)
- United Kingdom with a share of 4.71% (11.3 million US$)
- Bahrain with a share of 4.07% (9.82 million US$)
- Lebanon with a share of 1.97% (4.75 million US$)
- Egypt with a share of 1.88% (4.54 million US$)
Exports structure of 08 - Edible fruit and nuts; peel of citrus fruit or melons - from Jordan in 2023 represented by the following main commodity groups:
- 47% (115 million US$): 0809 - Apricots, cherries, peaches (including nectarines), plums and sloes, fresh.
- 25% (60 million US$): 0804 - Dates, figs, pineapples, avocados, guavas, mangoes and mangosteens, fresh or dried
- 13.4% (32 million US$): 0807 - Melons (including watermelons) and papaws (papayas), fresh.
- 8.03% (19.4 million US$): 0810 - Other fruit, fresh
- 1.64% (3.96 million US$): 0802 - Other nuts, fresh or dried, whether or not shelled or peeled
- 1.57% (3.8 million US$): 0806 - Grapes, fresh or dried
- 1.25% (3.02 million US$): 0805 - Citrus fruit, fresh or dried.
- 0.684% (1.65 million US$): 0808 - Apples, pears and quinces, fresh
- 0.239% (578 thousand US$): 0801 - Coconuts, Brazil nuts and cashew nuts, fresh or dried, whether or not shelled or peeled
- 0.076% (185 thousand US$): 0813 - Fruit, dried, other than that of headings Nos. 08.01 to 08.06; mixtures of nuts or dried fruits of this Chapter
The value of imports of commodity group 08 "Edible fruit and nuts; peel of citrus fruit or melons" to Jordan totalled $ 332 million in 2023. Sales of commodity group 08 to Jordan decreased by 1.55% in value terms compared to 2022. imports of commodity group 08 "Edible fruit and nuts; peel of citrus fruit or melons" decreased by $ 5.25 million (the value of imports of commodity group 08 to Jordan was equal to $337 million in 2022)
Imports of commodity group 08 "Edible fruit and nuts; peel of citrus fruit or melons" accounted for 1.29% of total import flow to Jordan (in 2023, total imports to Jordan amounted to $ 25 billion). The share of commodity group 08 in total imports to Jordan increased by 0.055 p.p. compared to 2022 (it was 1.23% in 2022 and cumulative imports to Jordan were equal to $ 27 billion).
Where does Jordan import Edible fruit and nuts; peel of citrus fruit or melons from?
Top trading partners (import of "Edible fruit and nuts; peel of citrus fruit or melons") of Jordan in 2023:
- USA with a share of 20% (67 million US$)
- Egypt with a share of 10.8% (36 million US$)
- Syrian Arab Republic with a share of 10.2% (34 million US$)
- Vietnam with a share of 8.6% (28 million US$)
- Ecuador with a share of 6.61% (22 million US$)
- Saudi Arabia with a share of 6.56% (21 million US$)
- Iran with a share of 4.34% (14.4 million US$)
- Greece with a share of 3.62% (12 million US$)
- Lebanon with a share of 3.43% (11.4 million US$)
- Italy with a share of 3.24% (10.7 million US$)
Imports structure of 08 - Edible fruit and nuts; peel of citrus fruit or melons - to Jordan in 2023 represented by the following main commodity groups:
- 35% (118 million US$): 0802 - Other nuts, fresh or dried, whether or not shelled or peeled
- 16.8% (56 million US$): 0804 - Dates, figs, pineapples, avocados, guavas, mangoes and mangosteens, fresh or dried
- 15.2% (50 million US$): 0808 - Apples, pears and quinces, fresh
- 9.24% (30 million US$): 0801 - Coconuts, Brazil nuts and cashew nuts, fresh or dried, whether or not shelled or peeled
- 7.52% (25 million US$): 0805 - Citrus fruit, fresh or dried.
- 7.13% (23 million US$): 0803 - Bananas, including plantains, fresh or dried
- 2.79% (9.31 million US$): 0810 - Other fruit, fresh
- 2.5% (8.32 million US$): 0806 - Grapes, fresh or dried
- 1.46% (4.86 million US$): 0809 - Apricots, cherries, peaches (including nectarines), plums and sloes, fresh.
- 0.827% (2.75 million US$): 0811 - Fruit and nuts, uncooked or cooked by steaming or boiling in water, frozen, whether or not containing added sugar or other sweetening matter