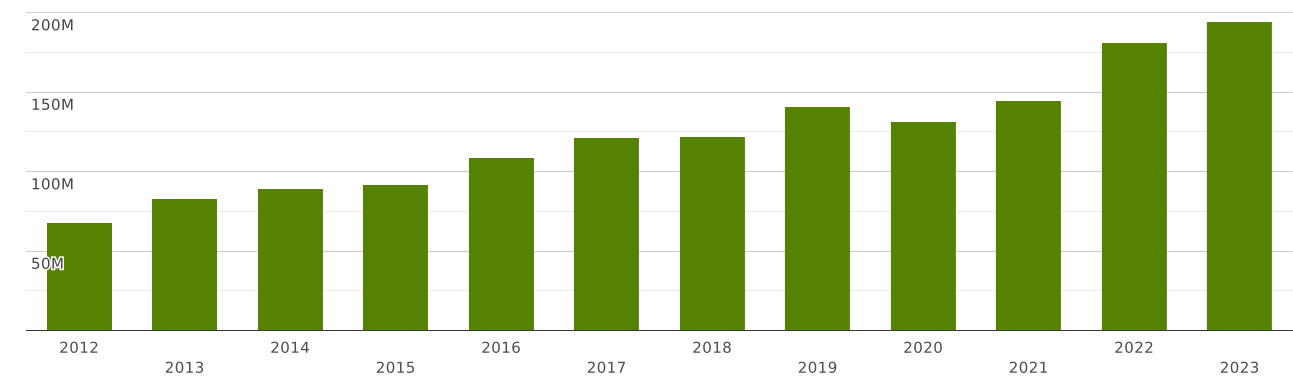
Jordan | Imports and Exports | World | Preparations of vegetables, fruit, nuts or other parts of plants | Value (US$) and Value Growth, YoY (%) | 2012 - 2023
The value of exports of commodity group 20 "Preparations of vegetables, fruit, nuts or other parts of plants" from Jordan totalled $ 119 million in 2023. Sales of commodity group 20 from Jordan went up by 11.1% compared to 2022: exports of commodity group 20 "Preparations of vegetables, fruit, nuts or other parts of plants" went up by $ 11.9 million (cumulative exports of commodity group 20 from Jordan amounted $107 million in 2022)
Exports of commodity group 20 "Preparations of vegetables, fruit, nuts or other parts of plants" amounted to 0.949% of total exports from Jordan (cumulative merchandise exports from Jordan totalled $ 12.5 billion in 2023). The share of commodity group 20 in total exports from Jordan increased by 0.08 p.p. compared to 2022 (it was 0.868% in 2022 and cumulative exports from Jordan were equal to $ 12.3 billion).
Where does Jordan export Preparations of vegetables, fruit, nuts or other parts of plants?
Top export destinations of "Preparations of vegetables, fruit, nuts or other parts of plants" from Jordan in 2023:
- Saudi Arabia with a share of 27% (32 million US$)
- Iraq with a share of 11.1% (13.2 million US$)
- State of Palestine with a share of 9.68% (11.5 million US$)
- USA with a share of 7.65% (9.14 million US$)
- Yemen with a share of 7.6% (9.09 million US$)
- Netherlands with a share of 6.77% (8.09 million US$)
- Qatar with a share of 6.27% (7.49 million US$)
- United Arab Emirates with a share of 5.15% (6.15 million US$)
- Kuwait with a share of 3.01% (3.6 million US$)
- Greece with a share of 2.42% (2.89 million US$)
Exports structure of 20 - Preparations of vegetables, fruit, nuts or other parts of plants - from Jordan in 2023 represented by the following main commodity groups:
- 55% (66 million US$): 2005 - Other vegetables prepared or preserved otherwise than by vinegar or acetic acid, not frozen, other than products of heading 20.06
- 24% (29 million US$): 2008 - Fruit, nuts and other edible parts of plants; prepared or preserved in ways n.e.s., whether or not containing added sugar or other sweetening matter or spirit, not elsewhere specified or included
- 7.23% (8.65 million US$): 2009 - Fruit or nut juices (including grape must) and vegetable juices, unfermented, not containing added spirit; whether or not containing added sugar or other sweetening matter
- 5.14% (6.14 million US$): 2001 - Vegetables, fruit, nuts and other edible parts of plants, prepared or preserved by vinegar or acetic acid
- 4.94% (5.9 million US$): 2002 - Tomatoes prepared or preserved otherwise than by vinegar or acetic acid
- 2.47% (2.95 million US$): 2007 - Jams, fruit jellies, marmalades, fruit or nut purTe and fruit or nut pastes, obtained by cooking, whether or not containing added sugar or other sweetening matter.
- 0.171% (205 thousand US$): 2004 - Other vegetables prepared or preserved otherwise than by vinegar or acetic acid, frozen, other than products of heading 20.06
- 0.053% (63 thousand US$): 2003 - Mushrooms and truffles, prepared or preserved otherwise than by vinegar or acetic acid
The value of imports of commodity group 20 "Preparations of vegetables, fruit, nuts or other parts of plants" to Jordan totalled $ 194 million in 2023. Sales of commodity group 20 to Jordan went up by 7.36% compared to 2022: imports of commodity group 20 "Preparations of vegetables, fruit, nuts or other parts of plants" went up by $ 13.3 million (the value of imports of commodity group 20 to Jordan was equal to $180 million in 2022)
Imports of commodity group 20 "Preparations of vegetables, fruit, nuts or other parts of plants" accounted for 0.755% of total import flow to Jordan (in 2023, total imports to Jordan amounted to $ 25 billion). The share of commodity group 20 in total imports to Jordan increased by 0.092 p.p. compared to 2022 (it was 0.662% in 2022 and cumulative imports to Jordan were equal to $ 27 billion).
Imports of commodity group 20 reached 99% of total imports of group 20 "Preparations of vegetables, fruit, nuts or other parts of plants" to Jordan in 2023 (imports of commodity group 20 to Jordan totalled $194 million in 2023). The share of purchases of commodity group 20 in imports of commodity group 20 to Jordan went down by 0 p.p. compared to 2022 (it was 100% in 2022, and imports of commodity group 20 to Jordan accounted for $180 million).
Where does Jordan import Preparations of vegetables, fruit, nuts or other parts of plants from?
Top trading partners (import of "Preparations of vegetables, fruit, nuts or other parts of plants") of Jordan in 2023:
- Egypt with a share of 26% (52 million US$)
- Belgium with a share of 22% (43 million US$)
- Netherlands with a share of 7.97% (15.4 million US$)
- China with a share of 6.14% (11.9 million US$)
- Saudi Arabia with a share of 4.95% (9.62 million US$)
- Turkey with a share of 4.42% (8.59 million US$)
- Thailand with a share of 2.64% (5.13 million US$)
- France with a share of 2.36% (4.59 million US$)
- Spain with a share of 2.36% (4.58 million US$)
- Lebanon with a share of 2.33% (4.54 million US$)
Imports structure of 20 - Preparations of vegetables, fruit, nuts or other parts of plants - to Jordan in 2023 represented by the following main commodity groups:
- 52% (101 million US$): 2004 - Other vegetables prepared or preserved otherwise than by vinegar or acetic acid, frozen, other than products of heading 20.06
- 11.5% (22 million US$): 2002 - Tomatoes prepared or preserved otherwise than by vinegar or acetic acid
- 9.41% (18.2 million US$): 2005 - Other vegetables prepared or preserved otherwise than by vinegar or acetic acid, not frozen, other than products of heading 20.06
- 8.7% (16.9 million US$): 2009 - Fruit or nut juices (including grape must) and vegetable juices, unfermented, not containing added spirit; whether or not containing added sugar or other sweetening matter
- 7.63% (14.8 million US$): 2008 - Fruit, nuts and other edible parts of plants; prepared or preserved in ways n.e.s., whether or not containing added sugar or other sweetening matter or spirit, not elsewhere specified or included
- 4.55% (8.85 million US$): 2007 - Jams, fruit jellies, marmalades, fruit or nut purTe and fruit or nut pastes, obtained by cooking, whether or not containing added sugar or other sweetening matter.
- 2.74% (5.33 million US$): 2003 - Mushrooms and truffles, prepared or preserved otherwise than by vinegar or acetic acid
- 2.66% (5.18 million US$): 2001 - Vegetables, fruit, nuts and other edible parts of plants, prepared or preserved by vinegar or acetic acid
- 0.326% (633 thousand US$): 2006 - Vegetables, fruit, nuts, fruit-peel and other parts of plants, preserved by sugar (drained, glacT or crystallised)