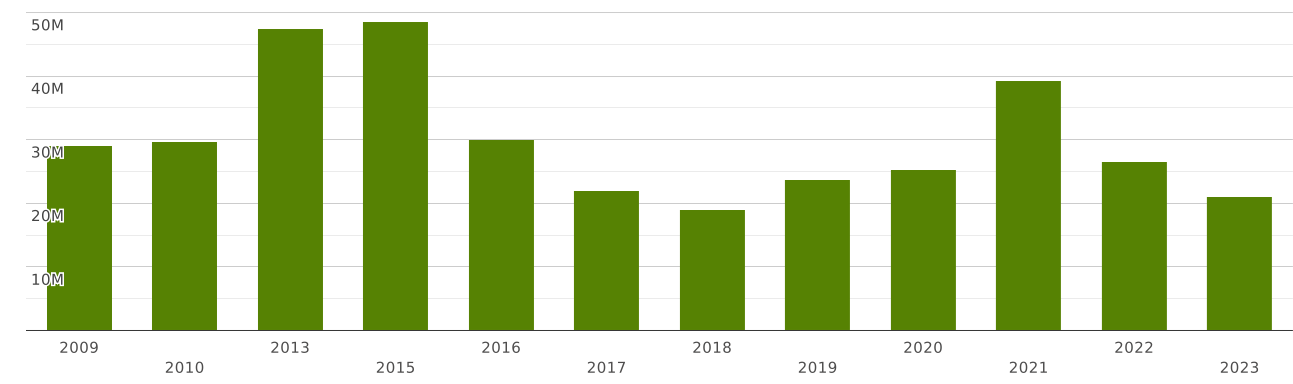
Kenya | Imports and Exports | World | Trailers and semi-trailers; other vehicles, not mechanically propelled; parts thereof | Value (US$) and Value Growth, YoY (%) | 2009 - 2023
The value of exports of commodity group 8716 "Trailers and semi-trailers; other vehicles, not mechanically propelled; parts thereof" from Kenya totalled $ 19 million in 2023. Sales of commodity group 8716 from Kenya went up by 53% compared to 2022: exports of commodity group 8716 "Trailers and semi-trailers; other vehicles, not mechanically propelled; parts thereof" went up by $ 6.6 million (cumulative exports of commodity group 8716 from Kenya amounted $12.4 million in 2022)
Exports of commodity group 8716 "Trailers and semi-trailers; other vehicles, not mechanically propelled; parts thereof" amounted to 0.265% of total exports from Kenya (cumulative merchandise exports from Kenya totalled $ 7.15 billion in 2023). The share of commodity group 8716 in total exports from Kenya increased by 0.077 p.p. compared to 2022 (it was 0.188% in 2022 and cumulative exports from Kenya were equal to $ 6.58 billion).
Exports of commodity group 8716 amounted to 16.4% of total sales of group "" from Kenya in 2023 (the value of exports of commodity group from Kenya amounted to $115 million in 2023). The share of exports of commodity group 8716 in sales of commodity group from Kenya lowered by 16.5 p.p. compared to 2022 (it was 33% in 2022, and exports of commodity group from Kenya were $37 million).
Where does Kenya export Trailers and semi-trailers; other vehicles, not mechanically propelled; parts thereof?
Top export destinations of "Trailers and semi-trailers; other vehicles, not mechanically propelled; parts thereof" from Kenya in 2023:
- Tanzania with a share of 33% (6.42 million US$)
- Uganda with a share of 33% (6.34 million US$)
- Rwanda with a share of 7.89% (1.5 million US$)
- Dem. Rep. Congo with a share of 7.41% (1.41 million US$)
- South Sudan with a share of 5.06% (964 thousand US$)
- Zambia with a share of 4.95% (942 thousand US$)
- Iraq with a share of 2.93% (558 thousand US$)
- Eritrea with a share of 1.37% (261 thousand US$)
- Angola - 168 thousand US$
- Malawi - 147 thousand US$
Exports structure of 8716 - Trailers and semi-trailers; other vehicles, not mechanically propelled; parts thereof - from Kenya in 2023 represented by the following main commodity groups:
- 53% (10.2 million US$): 871640 - Trailers & semi-trailers (excl. of 8716.10-8716.39)
- 17.6% (3.36 million US$): 871639 - Trailers & semi-trailers for the tpt. of gds. (excl. of 8716.10-8716.31)
- 17.1% (3.25 million US$): 871631 - Tanker trailers & tanker semi-trailers
- 10.9% (2.08 million US$): 871680 - Other vehicles, not mechanically propelled, n.e.s.
- 0.583% (111 thousand US$): 871690 - Parts of the vehicles of 87.16
- 0.092% (17.6 thousand US$): 871610 - Trailers & semi-trailers of the caravan type, for housing/camping
The value of imports of commodity group 8716 "Trailers and semi-trailers; other vehicles, not mechanically propelled; parts thereof" to Kenya totalled $ 21 million in 2023. Sales of commodity group 8716 to Kenya decreased by 20% in value terms compared to 2022. imports of commodity group 8716 "Trailers and semi-trailers; other vehicles, not mechanically propelled; parts thereof" decreased by $ 5.45 million (the value of imports of commodity group 8716 to Kenya was equal to $26 million in 2022)
Imports of commodity group 8716 "Trailers and semi-trailers; other vehicles, not mechanically propelled; parts thereof" accounted for 0.113% of total import flow to Kenya (in 2023, total imports to Kenya amounted to $ 18.6 billion). The share of commodity group 8716 in total imports to Kenya decreased by 0.012 p.p. compared to 2022 (it was 0.125% in 2022 and cumulative imports to Kenya were equal to $ 21 billion).
Imports of commodity group 8716 reached 2.41% of total imports of group "" to Kenya in 2023 (imports of commodity group to Kenya totalled $873 million in 2023). The share of purchases of commodity group 8716 in imports of commodity group to Kenya went down by 0.099 p.p. compared to 2022 (it was 2.51% in 2022, and imports of commodity group to Kenya accounted for $1.05 billion).
Where does Kenya import Trailers and semi-trailers; other vehicles, not mechanically propelled; parts thereof from?
Top trading partners (import of "Trailers and semi-trailers; other vehicles, not mechanically propelled; parts thereof") of Kenya in 2023:
- China with a share of 64% (13.5 million US$)
- Germany with a share of 15.1% (3.21 million US$)
- India with a share of 5.4% (1.14 million US$)
- Turkey with a share of 4.86% (1.02 million US$)
- France with a share of 3.79% (801 thousand US$)
- Australia with a share of 1.77% (375 thousand US$)
- United Kingdom with a share of 1.15% (243 thousand US$)
- South Africa with a share of 1.03% (218 thousand US$)
- Areas, nes - 124 thousand US$
- Pakistan - 75 thousand US$
Imports structure of 8716 - Trailers and semi-trailers; other vehicles, not mechanically propelled; parts thereof - to Kenya in 2023 represented by the following main commodity groups:
- 68% (14.4 million US$): 871640 - Trailers & semi-trailers (excl. of 8716.10-8716.39)
- 15.1% (3.19 million US$): 871690 - Parts of the vehicles of 87.16
- 6.18% (1.3 million US$): 871631 - Tanker trailers & tanker semi-trailers
- 5.38% (1.13 million US$): 871639 - Trailers & semi-trailers for the tpt. of gds. (excl. of 8716.10-8716.31)
- 3.46% (732 thousand US$): 871680 - Other vehicles, not mechanically propelled, n.e.s.
- 1.11% (235 thousand US$): 871620 - Self-loading/self-unloading trailers & semi-trailers for agricultural purps.
- 0.398% (84 thousand US$): 871610 - Trailers & semi-trailers of the caravan type, for housing/camping