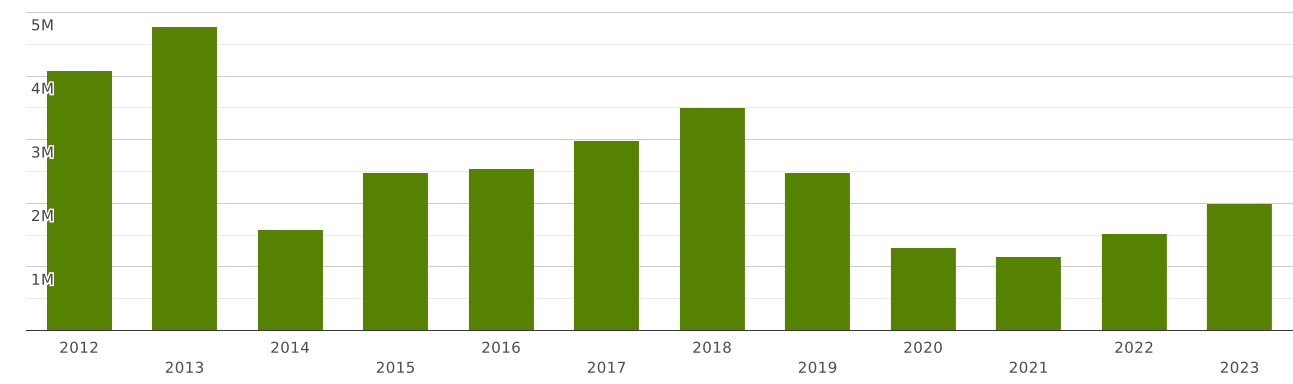
Lebanon | Imports and Exports | World | Grapes | Value (US$) and Value Growth, YoY (%) | 2012 - 2023
The value of exports of commodity group 0806 "Grapes, fresh or dried" from Lebanon totalled $ 22 million in 2023. Sales of commodity group 0806 from Lebanon decreased by 52% in value terms compared to 2022. exports of commodity group 0806 "Grapes, fresh or dried" decreased by $ 25 million (cumulative exports of commodity group 0806 from Lebanon amounted $47 million in 2022)
Exports of commodity group 0806 "Grapes, fresh or dried" amounted to 0.489% of total exports from Lebanon (cumulative merchandise exports from Lebanon totalled $ 4.56 billion in 2023). The share of commodity group 0806 in total exports from Lebanon decreased by 0.737 p.p. compared to 2022 (it was 1.22% in 2022 and cumulative exports from Lebanon were equal to $ 3.86 billion).
Exports of commodity group 0806 amounted to 21% of total sales of group "" from Lebanon in 2023 (the value of exports of commodity group from Lebanon amounted to $105 million in 2023). The share of exports of commodity group 0806 in sales of commodity group from Lebanon lowered by 2.35 p.p. compared to 2022 (it was 23% in 2022, and exports of commodity group from Lebanon were $201 million).
Where does Lebanon export Grapes, fresh or dried?
Top export destinations of "Grapes, fresh or dried" from Lebanon in 2023:
- United Arab Emirates with a share of 33% (7.45 million US$)
- Oman with a share of 9.42% (2.1 million US$)
- Iraq with a share of 7.87% (1.75 million US$)
- Egypt with a share of 7.48% (1.66 million US$)
- Kuwait with a share of 5.9% (1.31 million US$)
- Malaysia with a share of 4.53% (1.01 million US$)
- Netherlands with a share of 4.35% (971 thousand US$)
- United Kingdom with a share of 4.32% (965 thousand US$)
- Turkey with a share of 2.27% (508 thousand US$)
- Nigeria with a share of 2.15% (481 thousand US$)
Exports structure of 0806 - Grapes, fresh or dried - from Lebanon in 2023 represented by the following main commodity groups:
- 98% (21 million US$): 080610 - Grapes, fresh
- 1.48% (331 thousand US$): 080620 - Grapes, dried
The value of imports of commodity group 0806 "Grapes, fresh or dried" to Lebanon totalled $ 1.99 million in 2023. Sales of commodity group 0806 to Lebanon went up by 31% compared to 2022: imports of commodity group 0806 "Grapes, fresh or dried" went up by $ 472 thousand (the value of imports of commodity group 0806 to Lebanon was equal to $1.51 million in 2022)
Imports of commodity group 0806 "Grapes, fresh or dried" accounted for 0.01% of total import flow to Lebanon (in 2023, total imports to Lebanon amounted to $ 18.1 billion). The share of commodity group 0806 in total imports to Lebanon increased by 0.003 p.p. compared to 2022 (it was 0.007% in 2022 and cumulative imports to Lebanon were equal to $ 19.5 billion).
Imports of commodity group 0806 reached 1.66% of total imports of group "" to Lebanon in 2023 (imports of commodity group to Lebanon totalled $119 million in 2023). The share of purchases of commodity group 0806 in total imports of commodity group to Lebanon increased by 0.234 p.p. compared to 2022 (it was 1.43% in 2022, and imports of commodity group to Lebanon accounted for $106 million).
Where does Lebanon import Grapes, fresh or dried from?
Top trading partners (import of "Grapes, fresh or dried") of Lebanon in 2023:
- Chile with a share of 47% (953 thousand US$)
- Iran with a share of 45% (909 thousand US$)
- Switzerland with a share of 2.43% (48 thousand US$)
- Lebanon with a share of 1.28% (25 thousand US$)
- Turkey with a share of 1.16% (23 thousand US$)
- Australia - 7.92 thousand US$
- South Africa - 7.3 thousand US$
- Uzbekistan - 4.88 thousand US$
- Netherlands - 2.25 thousand US$
- Kenya - 1.8 thousand US$
Imports structure of 0806 - Grapes, fresh or dried - to Lebanon in 2023 represented by the following main commodity groups:
- 97% (1.93 million US$): 080620 - Grapes, dried
- 2.53% (50 thousand US$): 080610 - Grapes, fresh