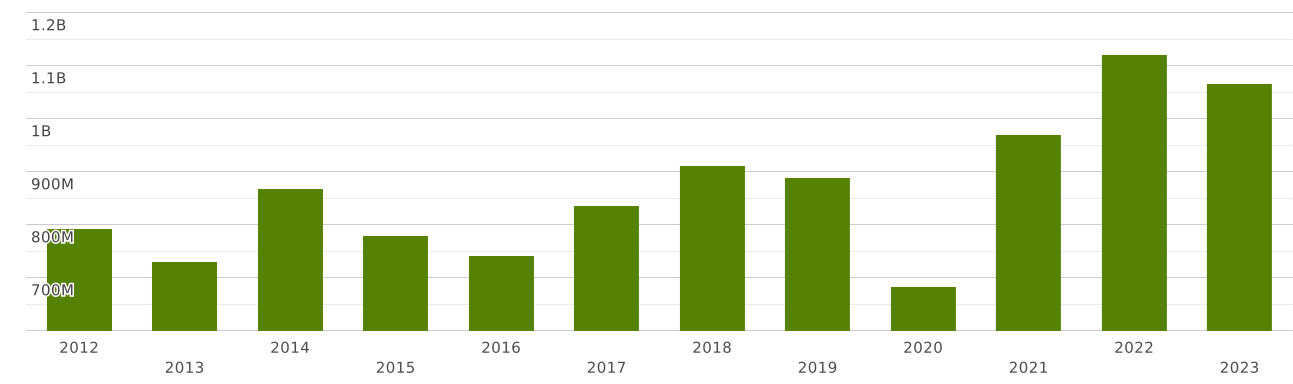
Mexico | Imports and Exports | World | Ceramic products | Value (US$) and Value Growth, YoY (%) | 2012 - 2023
The value of exports of commodity group 69 "Ceramic products" from Mexico totalled $ 1.6 billion in 2023. Sales of commodity group 69 from Mexico went up by 1.69% compared to 2022: exports of commodity group 69 "Ceramic products" went up by $ 26 million (cumulative exports of commodity group 69 from Mexico amounted $1.57 billion in 2022)
Exports of commodity group 69 "Ceramic products" amounted to 0.269% of total exports from Mexico (cumulative merchandise exports from Mexico totalled $ 592 billion in 2023). The share of commodity group 69 in total exports from Mexico decreased by 0.002 p.p. compared to 2022 (it was 0.272% in 2022 and cumulative exports from Mexico were equal to $ 577 billion).
Where does Mexico export Ceramic products?
Top export destinations of "Ceramic products" from Mexico in 2023:
- USA with a share of 86% (1.38 billion US$)
- Canada with a share of 3.07% (49 million US$)
- Germany with a share of 2.75% (44 million US$)
- Panama with a share of 1.61% (25 million US$)
- Guatemala - 13.4 million US$
- Areas, nes - 12.8 million US$
- Nicaragua - 12.2 million US$
- El Salvador - 10.6 million US$
- Costa Rica - 6.41 million US$
- Chile - 5.79 million US$
Exports structure of 69 - Ceramic products - from Mexico in 2023 represented by the following main commodity groups:
- 36% (577 million US$): 6910 - Ceramic sinks, wash basins, wash basin pedestals, baths, bidets, water closet pans, flushing cisterns, urinals and similar sanitary fixtures
- 18.7% (299 million US$): 6907 - Unglazed ceramic flags and paving, hearth or wall tiles; unglazed ceramic mosaic cubes and the like, whether or not on a backing
- 17.7% (284 million US$): 6909 - Ceramic wares for laboratory, chemical or other technical uses; ceramic troughs, tubs and similar receptacles of a kind used in agriculture; ceramic pots, jars and similar articles of a kind used for the conveyance or packing of goods.
- 10.3% (165 million US$): 6903 - Other refractory ceramic goods (for example, retorts, crucibles, muffles, nozzles, plugs, supports, cupels, tubes, pipes, sheaths and rods), other than those of siliceous fossil meals or of similar siliceous earths
- 2.44% (39 million US$): 6913 - Statuettes and other ornamental ceramic articles.
- 2.3% (36 million US$): 6904 - Ceramic building bricks, flooring blocks, support or filler tiles and the like.
- 2.03% (32 million US$): 6912 - Ceramic tableware, kitchenware, other household articles and toilet articles, other than of porcelain or china
- 1.59% (25 million US$): 6902 - Refractory bricks, blocks, tiles and similar refractory ceramic constructional goods, other than those of siliceous fossil meals or similar siliceous earths.
- 0.448% (7.18 million US$): 6914 - Other ceramic articles
- 0.409% (6.55 million US$): 6911 - Tableware, kitchenware, other household articles and toilet articles, of porcelain or china
The value of imports of commodity group 69 "Ceramic products" to Mexico totalled $ 1.06 billion in 2023. Sales of commodity group 69 to Mexico decreased by 4.79% in value terms compared to 2022. imports of commodity group 69 "Ceramic products" decreased by $ 53 million (the value of imports of commodity group 69 to Mexico was equal to $1.12 billion in 2022)
Imports of commodity group 69 "Ceramic products" accounted for 0.178% of total import flow to Mexico (in 2023, total imports to Mexico amounted to $ 598 billion). The share of commodity group 69 in total imports to Mexico decreased by 0.007 p.p. compared to 2022 (it was 0.185% in 2022 and cumulative imports to Mexico were equal to $ 604 billion).
Where does Mexico import Ceramic products from?
Top trading partners (import of "Ceramic products") of Mexico in 2023:
- USA with a share of 28% (301 million US$)
- China with a share of 27% (293 million US$)
- India with a share of 13% (139 million US$)
- Spain with a share of 7.04% (75 million US$)
- Italy with a share of 5.26% (56 million US$)
- Germany with a share of 5.21% (55 million US$)
- Austria with a share of 1.51% (16.1 million US$)
- Japan with a share of 1.43% (15.3 million US$)
- United Kingdom with a share of 1.14% (12.2 million US$)
- Colombia with a share of 1.13% (12.1 million US$)
Imports structure of 69 - Ceramic products - to Mexico in 2023 represented by the following main commodity groups:
- 24% (262 million US$): 6907 - Unglazed ceramic flags and paving, hearth or wall tiles; unglazed ceramic mosaic cubes and the like, whether or not on a backing
- 22% (237 million US$): 6909 - Ceramic wares for laboratory, chemical or other technical uses; ceramic troughs, tubs and similar receptacles of a kind used in agriculture; ceramic pots, jars and similar articles of a kind used for the conveyance or packing of goods.
- 13.7% (146 million US$): 6902 - Refractory bricks, blocks, tiles and similar refractory ceramic constructional goods, other than those of siliceous fossil meals or similar siliceous earths.
- 11.5% (122 million US$): 6903 - Other refractory ceramic goods (for example, retorts, crucibles, muffles, nozzles, plugs, supports, cupels, tubes, pipes, sheaths and rods), other than those of siliceous fossil meals or of similar siliceous earths
- 7.72% (82 million US$): 6912 - Ceramic tableware, kitchenware, other household articles and toilet articles, other than of porcelain or china
- 7.32% (78 million US$): 6910 - Ceramic sinks, wash basins, wash basin pedestals, baths, bidets, water closet pans, flushing cisterns, urinals and similar sanitary fixtures
- 3.36% (35 million US$): 6911 - Tableware, kitchenware, other household articles and toilet articles, of porcelain or china
- 3.26% (34 million US$): 6914 - Other ceramic articles
- 0.979% (10.4 million US$): 6913 - Statuettes and other ornamental ceramic articles.
- 0.052% (555 thousand US$): 6906 - Ceramic pipes, conduits, guttering and pipe fittings.