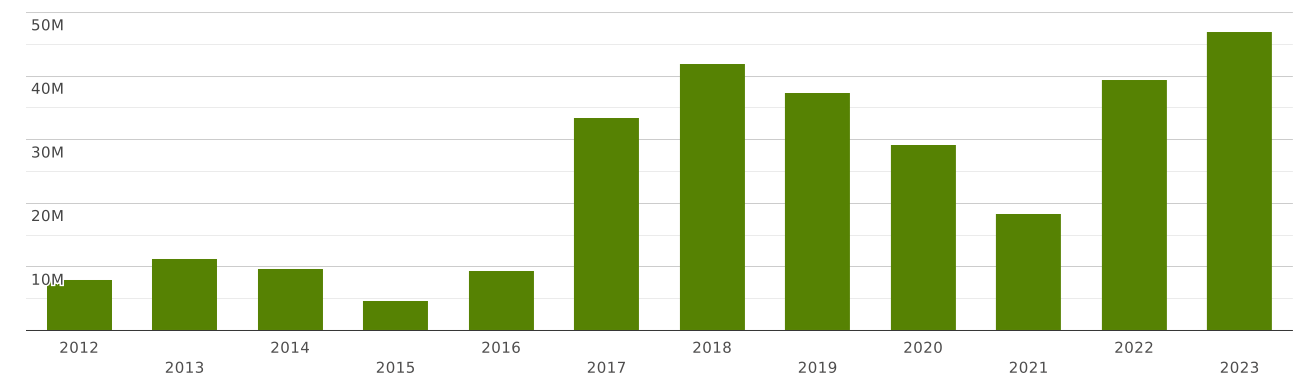
Myanmar | Imports and Exports | World | Products of animal origin, not elsewhere specified or included | Value (US$) and Value Growth, YoY (%) | 2012 - 2023
The value of exports of commodity group 05 "Products of animal origin, not elsewhere specified or included" from Myanmar totalled $ 7.36 million in 2023. Sales of commodity group 05 from Myanmar went up by 606% compared to 2022: exports of commodity group 05 "Products of animal origin, not elsewhere specified or included" went up by $ 6.31 million (cumulative exports of commodity group 05 from Myanmar amounted $1.04 million in 2022)
Exports of commodity group 05 "Products of animal origin, not elsewhere specified or included" amounted to 0.049% of total exports from Myanmar (cumulative merchandise exports from Myanmar totalled $ 14.7 billion in 2023). The share of commodity group 05 in total exports from Myanmar increased by 0.043 p.p. compared to 2022 (it was 0.006% in 2022 and cumulative exports from Myanmar were equal to $ 17 billion).
Where does Myanmar export Products of animal origin, not elsewhere specified or included?
Top export destinations of "Products of animal origin, not elsewhere specified or included" from Myanmar in 2023:
- China with a share of 80% (5.9 million US$)
- Vietnam with a share of 9.93% (731 thousand US$)
- Thailand with a share of 4.22% (311 thousand US$)
- Korea with a share of 2.63% (194 thousand US$)
- Japan with a share of 1.82% (134 thousand US$)
- Russia - 26 thousand US$
- Nigeria - 16 thousand US$
- Lithuania - 13.9 thousand US$
- Indonesia - 13.3 thousand US$
- Hong Kong - 12.2 thousand US$
Exports structure of 05 - Products of animal origin, not elsewhere specified or included - from Myanmar in 2023 represented by the following main commodity groups:
- 88% (6.48 million US$): 0508 - Coral and similar materials, unworked or simply prepared but not otherwise worked; shells of molluscs, crustaceans or echinoderms and cuttle-bone, unworked or simply prepared but not cut to shape, powder and waste thereof
- 4.61% (339 thousand US$): 0501 - Human hair, unworked, whether or not washed or scoured; waste of human hair
- 2.3% (169 thousand US$): 0511 - Animal products not elsewhere specified or included; dead animals of Chapter 1 or 3, unfit for human consumption
- 1.91% (140 thousand US$): 0505 - Skins and other parts of birds, with their feathers or down, feathers and parts of feathers (whether or not with trimmed edges) and down, not further worked than cleaned, disinfected or treated for preservation; powder and waste of feathers or parts of feathers
- 1.82% (134 thousand US$): 0506 - Bones and horn-cores, unworked, defatted,simply prepared (but not cut to shape), treated with acid or degelatinised; powder and waste of these products
- 1.25% (92 thousand US$): 0507 - Ivory, tortoise-shell, whalebone and whalebone hair, horns, antlers, hooves, nails, claws and beaks, unworked or simply prepared but not cut to shape; powder and waste of these products
The value of imports of commodity group 05 "Products of animal origin, not elsewhere specified or included" to Myanmar totalled $ 47 million in 2023. Sales of commodity group 05 to Myanmar went up by 18.9% compared to 2022: imports of commodity group 05 "Products of animal origin, not elsewhere specified or included" went up by $ 7.5 million (the value of imports of commodity group 05 to Myanmar was equal to $39 million in 2022)
Imports of commodity group 05 "Products of animal origin, not elsewhere specified or included" accounted for 0.286% of total import flow to Myanmar (in 2023, total imports to Myanmar amounted to $ 16.4 billion). The share of commodity group 05 in total imports to Myanmar increased by 0.058 p.p. compared to 2022 (it was 0.227% in 2022 and cumulative imports to Myanmar were equal to $ 17.4 billion).
Where does Myanmar import Products of animal origin, not elsewhere specified or included from?
Top trading partners (import of "Products of animal origin, not elsewhere specified or included") of Myanmar in 2023:
- India with a share of 35% (16.7 million US$)
- China with a share of 32% (15 million US$)
- Pakistan with a share of 14.3% (6.76 million US$)
- Vietnam with a share of 6.35% (2.99 million US$)
- Other Asia, nes with a share of 4.22% (1.98 million US$)
- Italy with a share of 3.27% (1.53 million US$)
- Spain with a share of 1.55% (730 thousand US$)
- Japan - 412 thousand US$
- Thailand - 213 thousand US$
- Afghanistan - 121 thousand US$
Imports structure of 05 - Products of animal origin, not elsewhere specified or included - to Myanmar in 2023 represented by the following main commodity groups:
- 51% (24 million US$): 0501 - Human hair, unworked, whether or not washed or scoured; waste of human hair
- 48% (22 million US$): 0505 - Skins and other parts of birds, with their feathers or down, feathers and parts of feathers (whether or not with trimmed edges) and down, not further worked than cleaned, disinfected or treated for preservation; powder and waste of feathers or parts of feathers
- 0.123% (58 thousand US$): 0511 - Animal products not elsewhere specified or included; dead animals of Chapter 1 or 3, unfit for human consumption