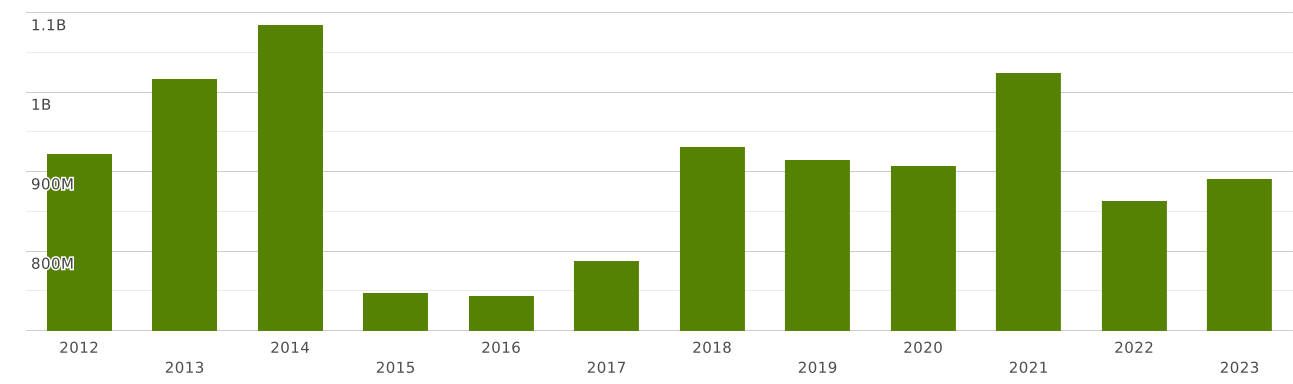
Netherlands | Imports and Exports | World | Grapes | Value (US$) and Value Growth, YoY (%) | 2012 - 2023
The value of exports of commodity group 0806 "Grapes, fresh or dried" from Netherlands totalled $ 942 million in 2023. Sales of commodity group 0806 from Netherlands went up by 21% compared to 2022: exports of commodity group 0806 "Grapes, fresh or dried" went up by $ 165 million (cumulative exports of commodity group 0806 from Netherlands amounted $776 million in 2022)
Exports of commodity group 0806 "Grapes, fresh or dried" amounted to 0.127% of total exports from Netherlands (cumulative merchandise exports from Netherlands totalled $ 741 billion in 2023). The share of commodity group 0806 in total exports from Netherlands increased by 0.025 p.p. compared to 2022 (it was 0.101% in 2022 and cumulative exports from Netherlands were equal to $ 768 billion).
Exports of commodity group 0806 amounted to 11% of total sales of group "" from Netherlands in 2023 (the value of exports of commodity group from Netherlands amounted to $8.55 billion in 2023). The share of exports of commodity group 0806 in sales of commodity group from Netherlands increased by 0.459 p.p. compared to 2022 (it was 10.5% in 2022, and exports of commodity group from Netherlands were $7.35 billion).
Where does Netherlands export Grapes, fresh or dried?
Top export destinations of "Grapes, fresh or dried" from Netherlands in 2023:
- Germany with a share of 38% (364 million US$)
- Poland with a share of 8.49% (80 million US$)
- Belgium with a share of 7.65% (72 million US$)
- Czech Republic with a share of 4.97% (46 million US$)
- France with a share of 4.42% (41 million US$)
- Spain with a share of 3.3% (31 million US$)
- Austria with a share of 3.13% (29 million US$)
- Finland with a share of 3.11% (29 million US$)
- Denmark with a share of 3.01% (28 million US$)
- Russia with a share of 2.94% (27 million US$)
Exports structure of 0806 - Grapes, fresh or dried - from Netherlands in 2023 represented by the following main commodity groups:
- 97% (914 million US$): 080610 - Grapes, fresh
- 2.97% (28 million US$): 080620 - Grapes, dried
The value of imports of commodity group 0806 "Grapes, fresh or dried" to Netherlands totalled $ 891 million in 2023. Sales of commodity group 0806 to Netherlands went up by 3.27% compared to 2022: imports of commodity group 0806 "Grapes, fresh or dried" went up by $ 28 million (the value of imports of commodity group 0806 to Netherlands was equal to $862 million in 2022)
Imports of commodity group 0806 "Grapes, fresh or dried" accounted for 0.134% of total import flow to Netherlands (in 2023, total imports to Netherlands amounted to $ 664 billion). The share of commodity group 0806 in total imports to Netherlands increased by 0.012 p.p. compared to 2022 (it was 0.121% in 2022 and cumulative imports to Netherlands were equal to $ 710 billion).
Imports of commodity group 0806 reached 10.7% of total imports of group "" to Netherlands in 2023 (imports of commodity group to Netherlands totalled $8.26 billion in 2023). The share of purchases of commodity group 0806 in imports of commodity group to Netherlands went down by 0.169 p.p. compared to 2022 (it was 10.9% in 2022, and imports of commodity group to Netherlands accounted for $7.88 billion).
Where does Netherlands import Grapes, fresh or dried from?
Top trading partners (import of "Grapes, fresh or dried") of Netherlands in 2023:
- South Africa with a share of 25% (224 million US$)
- Peru with a share of 15.3% (137 million US$)
- India with a share of 10.9% (97 million US$)
- Chile with a share of 8.33% (74 million US$)
- Turkey with a share of 7.39% (65 million US$)
- Egypt with a share of 7.37% (65 million US$)
- Spain with a share of 4.7% (41 million US$)
- Germany with a share of 4.49% (40 million US$)
- Brazil with a share of 4.07% (36 million US$)
- Italy with a share of 2.7% (24 million US$)
Imports structure of 0806 - Grapes, fresh or dried - to Netherlands in 2023 represented by the following main commodity groups:
- 87% (778 million US$): 080610 - Grapes, fresh
- 12.5% (112 million US$): 080620 - Grapes, dried