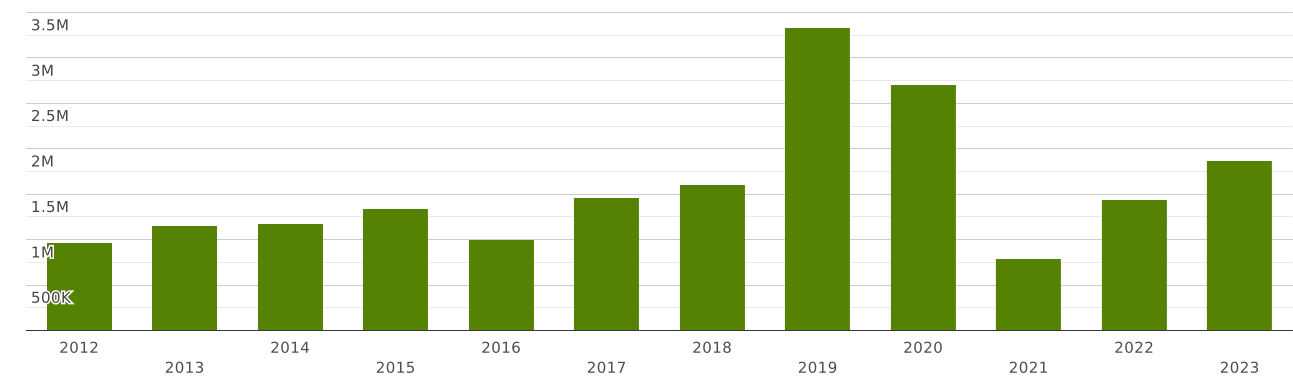
New Zealand | Imports and Exports | World | -Of a fat content, by weight, exceeding 1 % but not exceeding 6 % | Value (US$) and Value Growth, YoY (%) | 2012 - 2023
The value of exports of commodity group 040120 "Milk & cream, not concentrated / sweetened, fat content by wt. >1% but not >6%" from New Zealand totalled $ 259 million in 2023. Sales of commodity group 040120 from New Zealand decreased by 9.68% in value terms compared to 2022. exports of commodity group 040120 "Milk & cream, not concentrated / sweetened, fat content by wt. >1% but not >6%" decreased by $ 27 million (cumulative exports of commodity group 040120 from New Zealand amounted $287 million in 2022)
Exports of commodity group 040120 "Milk & cream, not concentrated / sweetened, fat content by wt. >1% but not >6%" amounted to 0.616% of total exports from New Zealand (cumulative merchandise exports from New Zealand totalled $ 42 billion in 2023). The share of commodity group 040120 in total exports from New Zealand decreased by 0.014 p.p. compared to 2022 (it was 0.63% in 2022 and cumulative exports from New Zealand were equal to $ 45 billion).
Exports of commodity group 040120 amounted to 2.13% of total sales of group "" from New Zealand in 2023 (the value of exports of commodity group from New Zealand amounted to $12.1 billion in 2023). The share of exports of commodity group 040120 in sales of commodity group from New Zealand lowered by 0.04 p.p. compared to 2022 (it was 2.17% in 2022, and exports of commodity group from New Zealand were $13.2 billion).
Exports of commodity group 040120 amounted to 28 percent of total sales of group "" from New Zealand in 2023 (the value of exports of commodity group from New Zealand amounted to 903 million USD in 2023). The share of exports of commodity group 040120 in sales of commodity group from New Zealand lowered by 3.17 p.p. compared to 2022 (it was 31 percent in 2022, and exports of commodity group from New Zealand amounted to 901 million USD).
Where does New Zealand export Milk & cream, not concentrated / sweetened, fat content by wt. >1% but not >6%?
Top export destinations of "Milk & cream, not concentrated / sweetened, fat content by wt. >1% but not >6%" from New Zealand in 2023:
- China with a share of 74% (194 million US$)
- Philippines with a share of 5.33% (13.8 million US$)
- Other Asia, nes with a share of 5.03% (13 million US$)
- Malaysia with a share of 2.7% (7.01 million US$)
- Fiji with a share of 2.56% (6.65 million US$)
- Vietnam with a share of 1.38% (3.6 million US$)
- New Caledonia with a share of 1.17% (3.04 million US$)
- French Polynesia with a share of 1.04% (2.72 million US$)
- Tonga with a share of 1.03% (2.69 million US$)
- Samoa - 2.14 million US$
The value of imports of commodity group 040120 "Milk & cream, not concentrated / sweetened, fat content by wt. >1% but not >6%" to New Zealand totalled $ 1.87 million in 2023. Sales of commodity group 040120 to New Zealand went up by 30% compared to 2022: imports of commodity group 040120 "Milk & cream, not concentrated / sweetened, fat content by wt. >1% but not >6%" went up by $ 433 thousand (the value of imports of commodity group 040120 to New Zealand was equal to $1.44 million in 2022)
Imports of commodity group 040120 "Milk & cream, not concentrated / sweetened, fat content by wt. >1% but not >6%" accounted for 0.003% of total import flow to New Zealand (in 2023, total imports to New Zealand amounted to $ 50 billion). The share of commodity group 040120 in total imports to New Zealand increased by 0.001 p.p. compared to 2022 (it was 0.002% in 2022 and cumulative imports to New Zealand were equal to $ 54 billion).
Imports of commodity group 040120 reached 0.945% of total imports of group "" to New Zealand in 2023 (imports of commodity group to New Zealand totalled $198 million in 2023). The share of purchases of commodity group 040120 in total imports of commodity group to New Zealand increased by 0.173 p.p. compared to 2022 (it was 0.771% in 2022, and imports of commodity group to New Zealand accounted for $186 million).
Imports of commodity group 040120 reached 25 percent of total imports of group "" to New Zealand in 2023 (imports of commodity group to New Zealand totalled 7.27 million USD in 2023). The share of purchases of commodity group 040120 in total imports of commodity group to New Zealand increased by 4.72 p.p. compared to 2022 (it was 21 percent in 2022, and imports of commodity group to New Zealand accounted for 6.85 million USD).
Where does New Zealand import Milk & cream, not concentrated / sweetened, fat content by wt. >1% but not >6% from?
Top trading partners (import of "Milk & cream, not concentrated / sweetened, fat content by wt. >1% but not >6%") of New Zealand in 2023:
- Australia with a share of 67% (1.26 million US$)
- New Zealand with a share of 24% (460 thousand US$)
- India with a share of 3.45% (64 thousand US$)
- Fiji with a share of 2.69% (50 thousand US$)
- Ireland - 18.3 thousand US$
- Philippines - 5 thousand US$
- Thailand - 4.65 thousand US$
- Korea - 1.51 thousand US$
- Sri Lanka - 554 US$
- Indonesia - 4.91 US$