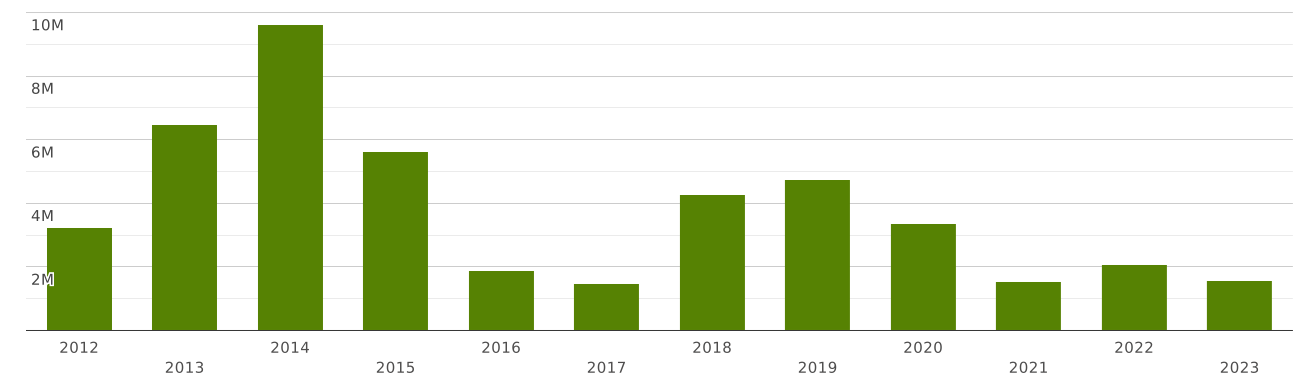
Nigeria | Imports and Exports | World | Other headgear, whether or not lined or trimmed | Value (US$) and Value Growth, YoY (%) | 2012 - 2023
Where does Nigeria export Other headgear, whether or not lined or trimmed?
Top export destinations of "Other headgear, whether or not lined or trimmed" from Nigeria in 2023:
Exports structure of 6506 - Other headgear, whether or not lined or trimmed - from Nigeria in 2023 represented by the following main commodity groups:
The value of imports of commodity group 6506 "Other headgear, whether or not lined or trimmed" to Nigeria totalled $ 1.57 million in 2023. Sales of commodity group 6506 to Nigeria decreased by 23% in value terms compared to 2022. imports of commodity group 6506 "Other headgear, whether or not lined or trimmed" decreased by $ 481 thousand (the value of imports of commodity group 6506 to Nigeria was equal to $2.06 million in 2022)
Imports of commodity group 6506 "Other headgear, whether or not lined or trimmed" accounted for 0.002% of total import flow to Nigeria (in 2023, total imports to Nigeria amounted to $ 65 billion). The share of commodity group 6506 in total imports to Nigeria decreased by 0 p.p. compared to 2022 (it was 0.003% in 2022 and cumulative imports to Nigeria were equal to $ 60 billion).
Imports of commodity group 6506 reached 49% of total imports of group "" to Nigeria in 2023 (imports of commodity group to Nigeria totalled $3.15 million in 2023). The share of purchases of commodity group 6506 in total imports of commodity group to Nigeria increased by 1.02 p.p. compared to 2022 (it was 48% in 2022, and imports of commodity group to Nigeria accounted for $4.21 million).
Where does Nigeria import Other headgear, whether or not lined or trimmed from?
Top trading partners (import of "Other headgear, whether or not lined or trimmed") of Nigeria in 2023:
- China with a share of 75% (1.19 million US$)
- India with a share of 12.2% (193 thousand US$)
- USA with a share of 5.47% (86 thousand US$)
- Germany with a share of 2.58% (40 thousand US$)
- Other Asia, nes - 14.4 thousand US$
- France - 10.5 thousand US$
- United Kingdom - 10.2 thousand US$
- Korea - 7.08 thousand US$
- Italy - 5.41 thousand US$
- Egypt - 2.16 thousand US$
Imports structure of 6506 - Other headgear, whether or not lined or trimmed - to Nigeria in 2023 represented by the following main commodity groups:
- 80% (1.27 million US$): 650610 - Safety headgear, whether or not lined/trimmed
- 10.4% (164 thousand US$): 650691 - Headgear, other than safety headgear, of rubber/plastics, whether or not PURS/hot lined/trimmed (excl. of 6506.10)
- 8.71% (137 thousand US$): 650699 - Headgear of mats. other than rubber/plastics/furskin, whether or not lined/trimmed (excl. safety headgear)