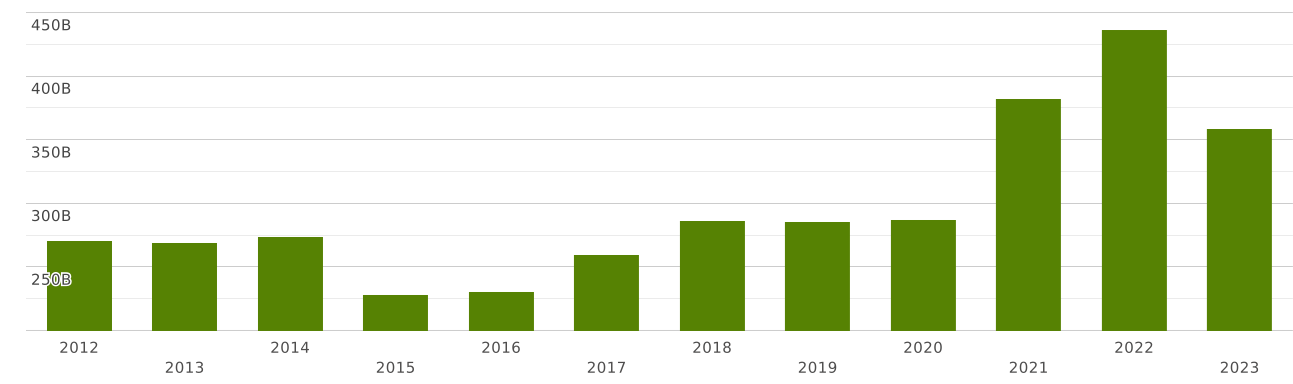
Other Asia, nes | Imports and Exports | World | ALL COMMODITIES | Value (US$) and Value Growth, YoY (%) | 2012 - 2023
| Commodity | Reporter | Partner | Trade flow | Indicator | 2012 | 2013 | 2014 | 2015 | 2016 | 2017 | 2018 | 2019 | 2020 | 2021 | 2022 | 2023 |
| TOTAL. ALL COMMODITIES | Other Asia, nes | World | Exports | Value (US$) | 300,621,665,704.00 | 303,726,395,541.00 | 313,563,342,380.00 | 280,019,266,828.00 | 280,478,676,099.00 | 317,663,172,110.08 | 335,743,566,738.82 | 329,483,858,291.42 | 347,194,556,373.19 | 447,656,546,120.09 | 477,816,742,263.50 | 432,204,004,148.43 |
| Value Growth, YoY (%) | -2.07 | 1.03 | 3.23 | -10.69 | 0.16 | 13.25 | 5.69 | -1.86 | 5.37 | 28.93 | 6.73 | -9.54 | ||||
| Imports | Value (US$) | 270,863,152,625.00 | 269,256,098,695.00 | 273,844,886,830.00 | 228,508,285,711.00 | 230,930,098,259.00 | 259,609,174,581.87 | 286,194,740,458.68 | 285,931,193,664.18 | 287,429,187,097.22 | 382,555,002,402.23 | 436,551,017,046.56 | 358,505,331,667.30 | |||
| Value Growth, YoY (%) | -3.71 | -0.59 | 1.70 | -16.55 | 1.05 | 12.41 | 10.24 | -0.09 | 0.52 | 33.09 | 14.11 | -17.87 |
The value of merchandise exports from Other Asia, nes totalled $ 432 billion in 2023. Overall commodity exports from Other Asia, nes decreased by 9.54% compared to 2022. Merchandise exports decreased by $ 45 billion (the value of merchandise exports from Other Asia, nes amounted to $477 billion in 2022)
Other Asia, nes's exports 2023 by country
Top export destinations of commodities from Other Asia, nes in 2023:
- China with a share of 22% (95 billion US$)
- USA with a share of 17.6% (76 billion US$)
- Hong Kong with a share of 13% (56 billion US$)
- Japan with a share of 7.25% (31 billion US$)
- Singapore with a share of 6.88% (29 billion US$)
- Korea with a share of 4.2% (18.1 billion US$)
- Malaysia with a share of 3.5% (15.1 billion US$)
- Netherlands with a share of 2.98% (12.9 billion US$)
- Vietnam with a share of 2.71% (11.7 billion US$)
- Thailand with a share of 2.51% (10.8 billion US$)
Exports structure from Other Asia, nes in 2023 represented by the following main commodity groups:
- 51% (222 billion US$): 85 - Electrical machinery and equipment and parts thereof; sound recorders and reproducers, television image and sound recorders and reproducers, and parts and accessories of such articles
- 17.9% (77 billion US$): 84 - Nuclear reactors, boilers, machinery and mechanical appliances; parts thereof
- 4.07% (17.6 billion US$): 39 - Plastics and articles thereof
- 3.04% (13.1 billion US$): 27 - Mineral fuels, mineral oils and products of their distillation; bituminous substances; mineral waxes
- 2.98% (12.9 billion US$): 90 - Optical, photographic, cinematographic, measuring, checking, precision, medical or surgical instruments and apparatus; parts and accessories thereof
- 2.64% (11.4 billion US$): 87 - Vehicles other than railway or tramway rolling stock, and parts and accessories thereof
- 2.11% (9.16 billion US$): 72 - Iron and steel
- 1.84% (7.96 billion US$): 29 - Organic chemicals
- 1.83% (7.91 billion US$): 73 - Articles of iron or steel
- 0.934% (4.03 billion US$): 74 - Copper and articles thereof
What did Other Asia, nes export in 2023?
Other Asia, nes's Top Exports in 2023:
- 38% ($166 billion): 8542 - Electronic integrated circuits and microassemblies
- 9.01% ($38 billion): 8471 - Automatic data processing machines and units thereof; magnetic or optical readers, machines for transcribing data onto data media in coded form and machines for processing such data, not elsewhere specified or included
- 3.31% ($14.3 billion): 8473 - Parts and accessories (other than covers, carrying cases and the like) suitable for use solely or principally with machines of headings 84.69 to 84.72
- 3% ($12.9 billion): 8517 - Electrical apparatus for line telephony or line telegraphy, including line telephone sets with cordless handsets and telecommunication apparatus for carrier-current line systems or for digital line systems; videophones
- 2.92% ($12.6 billion): 2710 - Petroleum oils and oils from bituminous minerals, not crude; preparations n.e.c. containing by weight 70% or more of petroleum oils or oils from bituminous minerals; these being the basic constituents of the preparations; waste oils
- 1.67% ($7.24 billion): 8523 - Discs, tapes, solid-state non-volatile storage devices, smart cards and other media for the recording of sound or of other phenomena, whether or not recorded, including matrices and masters for the production of discs, excluding products of Chapter 37
- 1.15% ($4.98 billion): 8534 - Printed circuits
- 1.1% ($4.76 billion): 8486 - Machines and apparatus of a kind used solely or principally for the manufacture of semiconductor boules or wafers, semiconductor devices, electronic integrated circuits or flat panel displays; machines & apparatus specified in note 11 (C) to this Chapter
- 1.06% ($4.58 billion): 7318 - Screws, bolts, nuts, coach screws, screw hooks, rivets, cotters, cotter-pins, washers (including spring washers) and similar articles, of iron or steel
- 1.04% ($4.5 billion): 8541 - Semiconductor devices (e.g. diodes, transistors, semiconductor based transducers); including photovoltaic cells assembled or not in modules or panels, light-emitting diodes (LED) assembled with other LEDs or not, mounted piezo-electric crystals
The value of merchandise imports to Other Asia, nes totalled $ 358 billion in 2023. Overall commodity imports to Other Asia, nes decreased by 17.8% compared to 2022. Merchandise imports decreased by $ 78 billion (the value of merchandise imports to Other Asia, nes was equal to $436 billion in 2022)
Other Asia, nes's imports 2023 by country
Top trading partners (import sources) of Other Asia, nes in 2023:
- China with a share of 19.6% (70 billion US$)
- Japan with a share of 12.3% (44 billion US$)
- USA with a share of 11.4% (40 billion US$)
- Korea with a share of 7.93% (28 billion US$)
- Australia with a share of 4.85% (17.4 billion US$)
- Other Asia, nes with a share of 4.71% (16.8 billion US$)
- Germany with a share of 3.86% (13.8 billion US$)
- Malaysia with a share of 2.7% (9.68 billion US$)
- Singapore with a share of 2.65% (9.5 billion US$)
- Saudi Arabia with a share of 2.55% (9.15 billion US$)
Imports structure to Other Asia, nes in 2023 represented by the following main commodity groups:
- 29% (107 billion US$): 85 - Electrical machinery and equipment and parts thereof; sound recorders and reproducers, television image and sound recorders and reproducers, and parts and accessories of such articles
- 15.8% (56 billion US$): 27 - Mineral fuels, mineral oils and products of their distillation; bituminous substances; mineral waxes
- 15.4% (55 billion US$): 84 - Nuclear reactors, boilers, machinery and mechanical appliances; parts thereof
- 4.37% (15.6 billion US$): 90 - Optical, photographic, cinematographic, measuring, checking, precision, medical or surgical instruments and apparatus; parts and accessories thereof
- 3.31% (11.8 billion US$): 87 - Vehicles other than railway or tramway rolling stock, and parts and accessories thereof
- 2.59% (9.3 billion US$): 72 - Iron and steel
- 2.13% (7.67 billion US$): 29 - Organic chemicals
- 2.03% (7.29 billion US$): 39 - Plastics and articles thereof
- 1.78% (6.4 billion US$): 38 - Miscellaneous chemical products
- 1.6% (5.74 billion US$): 30 - Pharmaceutical products
What did Other Asia, nes import in 2023?
Other Asia, nes's Top Imports in 2023:
- 20% ($73 billion): 8542 - Electronic integrated circuits and microassemblies
- 7.01% ($25 billion): 8486 - Machines and apparatus of a kind used solely or principally for the manufacture of semiconductor boules or wafers, semiconductor devices, electronic integrated circuits or flat panel displays; machines & apparatus specified in note 11 (C) to this Chapter
- 7% ($25 billion): 2709 - Petroleum oils and oils obtained from bituminous minerals, crude
- 3.72% ($13.3 billion): 2711 - Petroleum gases and other gaseous hydrocarbons
- 3.27% ($11.7 billion): 2701 - Coal; briquettes, ovoids and similar solid fuels manufactured from coal
- 2.2% ($7.91 billion): 8703 - Motor cars and other motor vehicles principally designed for the transport of persons (other than those of heading 87.02), including station wagons and racing cars
- 2% ($7.17 billion): 8517 - Electrical apparatus for line telephony or line telegraphy, including line telephone sets with cordless handsets and telecommunication apparatus for carrier-current line systems or for digital line systems; videophones
- 1.92% ($6.88 billion): 8471 - Automatic data processing machines and units thereof; magnetic or optical readers, machines for transcribing data onto data media in coded form and machines for processing such data, not elsewhere specified or included
- 1.72% ($6.19 billion): 2710 - Petroleum oils and oils from bituminous minerals, not crude; preparations n.e.c. containing by weight 70% or more of petroleum oils or oils from bituminous minerals; these being the basic constituents of the preparations; waste oils