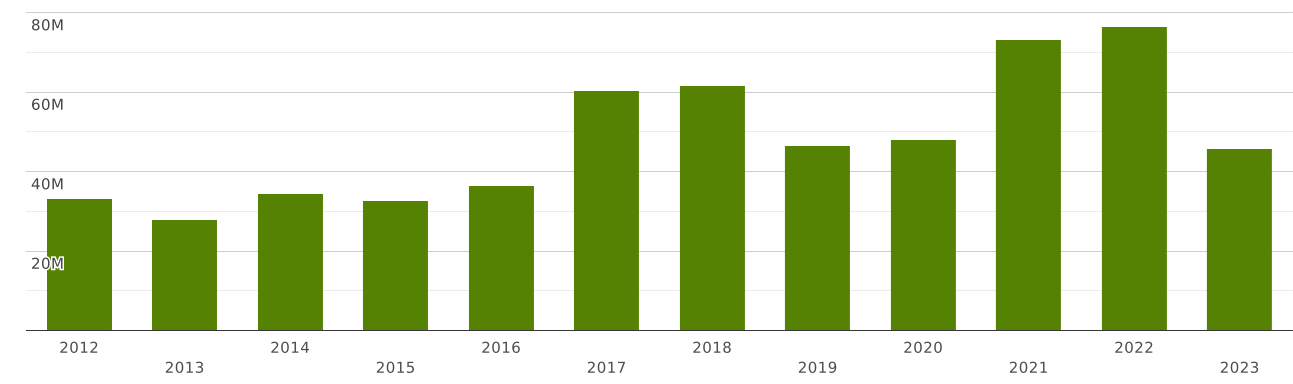
Pakistan | Imports and Exports | World | Ferro-alloys | Value (US$) and Value Growth, YoY (%) | 2012 - 2023
The value of exports of commodity group 7202 "Ferro-alloys." from Pakistan totalled $ 33 thousand in 2023. Sales of commodity group 7202 from Pakistan went up by 98% compared to 2022: exports of commodity group 7202 "Ferro-alloys." went up by $ 16.5 thousand (cumulative exports of commodity group 7202 from Pakistan amounted $16.7 thousand in 2022)
Exports of commodity group 7202 amounted to 0.038% of total sales of group "" from Pakistan in 2023 (the value of exports of commodity group from Pakistan amounted to $87 million in 2023). The share of exports of commodity group 7202 in sales of commodity group from Pakistan increased by 0.009 p.p. compared to 2022 (it was 0.028% in 2022, and exports of commodity group from Pakistan were $59 million).
Where does Pakistan export Ferro-alloys.?
Top export destinations of "Ferro-alloys." from Pakistan in 2023:
- Afghanistan with a share of 96% (32 thousand US$)
- United Arab Emirates with a share of 3.6% (1.19 thousand US$)
Exports structure of 7202 - Ferro-alloys. - from Pakistan in 2023 represented by the following main commodity groups:
- 98% (32 thousand US$): 720299 - Ferro-alloys; n.e.s. in heading no. 7202
- 1.68% (561 US$): 720219 - Ferro-manganese, other than that cont. by wt. >2% of carbon, in granular/powder form
- 0.184% (61 US$): 720221 - Ferro-silicon, cont. by wt. >55% of silicon, in granular/powder form
The value of imports of commodity group 7202 "Ferro-alloys." to Pakistan totalled $ 45 million in 2023. Sales of commodity group 7202 to Pakistan decreased by 40% in value terms compared to 2022. imports of commodity group 7202 "Ferro-alloys." decreased by $ 30 million (the value of imports of commodity group 7202 to Pakistan was equal to $76 million in 2022)
Imports of commodity group 7202 "Ferro-alloys." accounted for 0.091% of total import flow to Pakistan (in 2023, total imports to Pakistan amounted to $ 50 billion). The share of commodity group 7202 in total imports to Pakistan decreased by 0.017 p.p. compared to 2022 (it was 0.109% in 2022 and cumulative imports to Pakistan were equal to $ 70 billion).
Imports of commodity group 7202 reached 1.66% of total imports of group "" to Pakistan in 2023 (imports of commodity group to Pakistan totalled $2.75 billion in 2023). The share of purchases of commodity group 7202 in imports of commodity group to Pakistan went down by 0.28 p.p. compared to 2022 (it was 1.94% in 2022, and imports of commodity group to Pakistan accounted for $3.94 billion).
Where does Pakistan import Ferro-alloys. from?
Top trading partners (import of "Ferro-alloys.") of Pakistan in 2023:
- Zambia with a share of 68% (31 million US$)
- Vietnam with a share of 10.7% (4.91 million US$)
- Iran with a share of 7.64% (3.5 million US$)
- Malaysia with a share of 4.94% (2.26 million US$)
- China with a share of 3.38% (1.55 million US$)
- Tanzania with a share of 2.09% (960 thousand US$)
- United Arab Emirates - 395 thousand US$
- South Africa - 386 thousand US$
- Germany - 141 thousand US$
- Kazakhstan - 127 thousand US$
Imports structure of 7202 - Ferro-alloys. - to Pakistan in 2023 represented by the following main commodity groups:
- 80% (36 million US$): 720230 - Ferro-silico-manganese, in granular/powder form
- 7.67% (3.52 million US$): 720229 - Ferro-silicon, other than that cont. >55% of silicon, in granular/powder form
- 6.42% (2.94 million US$): 720211 - Ferro-manganese, cont. by wt. >2% of carbon, in granular/powder form
- 2.62% (1.2 million US$): 720221 - Ferro-silicon, cont. by wt. >55% of silicon, in granular/powder form
- 0.707% (324 thousand US$): 720219 - Ferro-manganese, other than that cont. by wt. >2% of carbon, in granular/powder form
- 0.697% (319 thousand US$): 720241 - Ferro-chromium, cont. by wt. >4% of carbon, in granular/powder form
- 0.572% (262 thousand US$): 720249 - Ferro-chromium, other than that cont. by wt. >4% of carbon, in granular/powder form
- 0.328% (150 thousand US$): 720299 - Ferro-alloys; n.e.s. in heading no. 7202
- 0.169% (77 thousand US$): 720270 - Ferro-molybdenum, in granular/powder form
- 0.071% (32 thousand US$): 720280 - Ferro-tungsten & ferro-silico-tungsten, in granular/powder form