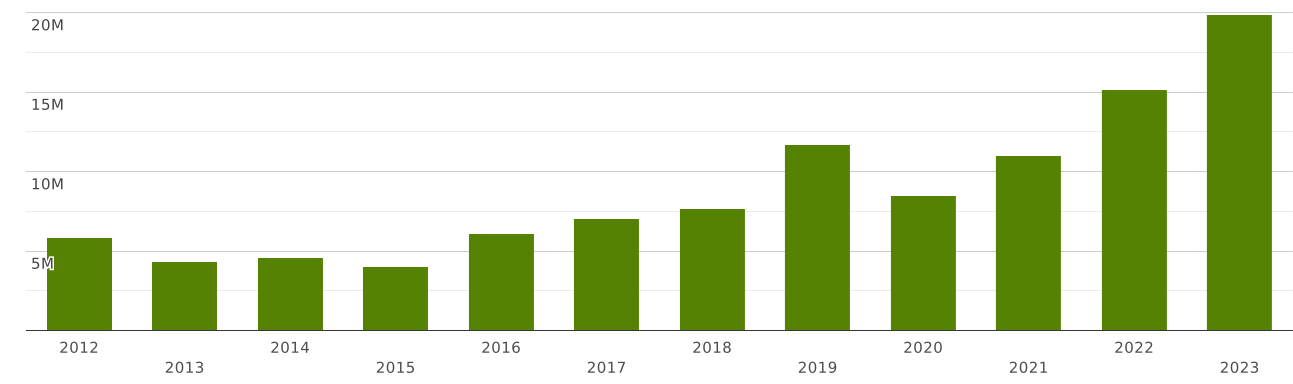
Philippines | Imports and Exports | World | Tea | Value (US$) and Value Growth, YoY (%) | 2012 - 2023
| Commodity | Reporter | Partner | Trade flow | Indicator | 2012 | 2013 | 2014 | 2015 | 2016 | 2017 | 2018 | 2019 | 2020 | 2021 | 2022 | 2023 |
| 0902. Tea, whether or not flavoured | Philippines | World | Exports | Value (US$) | 23,070.00 | 32,760.00 | 81,413.00 | 47,118.00 | 16,010.00 | 131,813.00 | 36,925.00 | 32,604.00 | 189,754.00 | 104,355.00 | 166,308.00 | 70,527.00 |
| Value Growth, YoY (%) | -97.64 | 42.00 | 148.51 | -42.12 | -66.02 | 723.31 | -71.98 | -11.70 | 481.99 | -45.00 | 59.36 | -57.59 | ||||
| Imports | Value (US$) | 5,817,846.00 | 4,352,917.00 | 4,591,051.00 | 4,004,701.00 | 6,079,265.00 | 7,069,611.00 | 7,665,361.00 | 11,683,791.00 | 8,519,286.00 | 11,025,825.00 | 15,159,144.00 | 19,850,318.00 | |||
| Value Growth, YoY (%) | 25.33 | -25.17 | 5.47 | -12.77 | 51.80 | 16.29 | 8.42 | 52.42 | -27.08 | 29.42 | 37.48 | 30.94 |
The value of exports of commodity group 0902 "Tea, whether or not flavoured" from Philippines totalled $ 70 thousand in 2023. Sales of commodity group 0902 from Philippines decreased by 57% in value terms compared to 2022. exports of commodity group 0902 "Tea, whether or not flavoured" decreased by $ 95 thousand (cumulative exports of commodity group 0902 from Philippines amounted $166 thousand in 2022)
Exports of commodity group 0902 amounted to 5.86% of total sales of group "" from Philippines in 2023 (the value of exports of commodity group from Philippines amounted to $1.2 million in 2023). The share of exports of commodity group 0902 in sales of commodity group from Philippines lowered by 1.43 p.p. compared to 2022 (it was 7.3% in 2022, and exports of commodity group from Philippines were $2.27 million).
Where does Philippines export Tea, whether or not flavoured?
Top export destinations of "Tea, whether or not flavoured" from Philippines in 2023:
- United Arab Emirates with a share of 40% (28 thousand US$)
- USA with a share of 25% (18.1 thousand US$)
- Switzerland with a share of 16.7% (11.8 thousand US$)
- Netherlands with a share of 7.42% (5.23 thousand US$)
- Italy with a share of 2.85% (2.01 thousand US$)
- Hong Kong with a share of 1.89% (1.33 thousand US$)
- Bahrain with a share of 1.78% (1.25 thousand US$)
- Cyprus with a share of 1.48% (1.04 thousand US$)
- New Zealand - 602 US$
- Guam - 442 US$
Exports structure of 0902 - Tea, whether or not flavoured - from Philippines in 2023 represented by the following main commodity groups:
- 50% (35 thousand US$): 090210 - Tea, green (not fermented), whether or not flavoured, in immediate packings of a content not >3kg
- 29% (20 thousand US$): 090220 - Tea, green (not fermented), whether or not flavoured, in immediate packings of a content >3kg
- 19.8% (14 thousand US$): 090240 - Tea, black (fermented) & partly fermented tea, whether or not flavoured, in immediate packings of a content >3kg
- 0.175% (124 US$): 090230 - Tea, black (fermented) & partly fermented tea, whether or not flavoured, in immediate packings of a content not >3kg
The value of imports of commodity group 0902 "Tea, whether or not flavoured" to Philippines totalled $ 19.8 million in 2023. Sales of commodity group 0902 to Philippines went up by 30% compared to 2022: imports of commodity group 0902 "Tea, whether or not flavoured" went up by $ 4.69 million (the value of imports of commodity group 0902 to Philippines was equal to $15.1 million in 2022)
Imports of commodity group 0902 "Tea, whether or not flavoured" accounted for 0.014% of total import flow to Philippines (in 2023, total imports to Philippines amounted to $ 133 billion). The share of commodity group 0902 in total imports to Philippines increased by 0.004 p.p. compared to 2022 (it was 0.01% in 2022 and cumulative imports to Philippines were equal to $ 145 billion).
Imports of commodity group 0902 reached 9.37% of total imports of group "" to Philippines in 2023 (imports of commodity group to Philippines totalled $211 million in 2023). The share of purchases of commodity group 0902 in total imports of commodity group to Philippines increased by 1.55 p.p. compared to 2022 (it was 7.82% in 2022, and imports of commodity group to Philippines accounted for $193 million).
Where does Philippines import Tea, whether or not flavoured from?
Top trading partners (import of "Tea, whether or not flavoured") of Philippines in 2023:
- Japan with a share of 21% (4.28 million US$)
- Indonesia with a share of 20% (4.01 million US$)
- Poland with a share of 19.1% (3.8 million US$)
- Vietnam with a share of 11.9% (2.37 million US$)
- China with a share of 6.98% (1.38 million US$)
- Other Asia, nes with a share of 4.43% (880 thousand US$)
- Sri Lanka with a share of 4.42% (877 thousand US$)
- United Arab Emirates with a share of 2.32% (460 thousand US$)
- United Kingdom with a share of 2.18% (434 thousand US$)
- India with a share of 2.12% (421 thousand US$)
Imports structure of 0902 - Tea, whether or not flavoured - to Philippines in 2023 represented by the following main commodity groups:
- 47% (9.38 million US$): 090210 - Tea, green (not fermented), whether or not flavoured, in immediate packings of a content not >3kg
- 24% (4.82 million US$): 090230 - Tea, black (fermented) & partly fermented tea, whether or not flavoured, in immediate packings of a content not >3kg
- 17.9% (3.57 million US$): 090220 - Tea, green (not fermented), whether or not flavoured, in immediate packings of a content >3kg
- 10.4% (2.06 million US$): 090240 - Tea, black (fermented) & partly fermented tea, whether or not flavoured, in immediate packings of a content >3kg