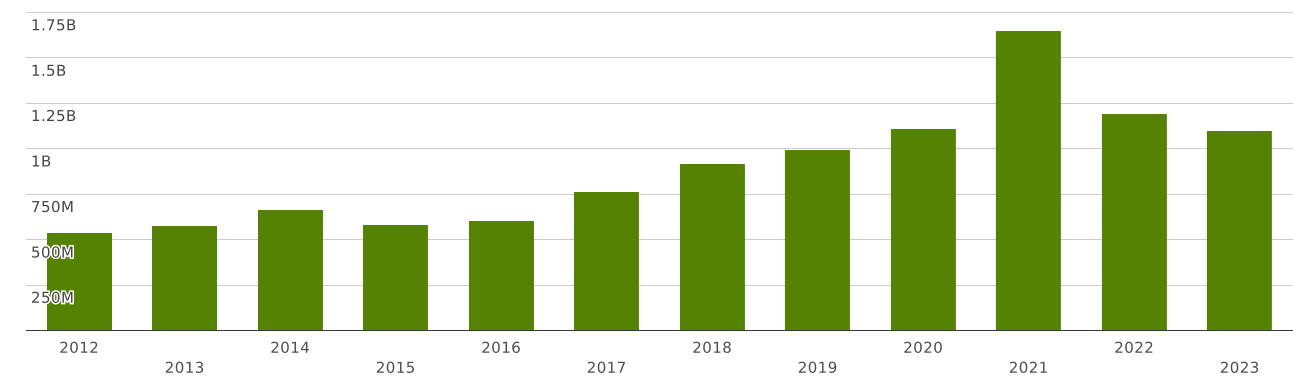
Poland | Imports and Exports | World | Other furniture and parts thereof | Value (US$) and Value Growth, YoY (%) | 2012 - 2023
The value of exports of commodity group 9403 "Other furniture and parts thereof" from Poland totalled $ 5.89 billion in 2023. Sales of commodity group 9403 from Poland went up by 0.861% compared to 2022: exports of commodity group 9403 "Other furniture and parts thereof" went up by $ 50 million (cumulative exports of commodity group 9403 from Poland amounted $5.84 billion in 2022)
Exports of commodity group 9403 "Other furniture and parts thereof" amounted to 1.66% of total exports from Poland (cumulative merchandise exports from Poland totalled $ 354 billion in 2023). The share of commodity group 9403 in total exports from Poland decreased by 0.042 p.p. compared to 2022 (it was 1.7% in 2022 and cumulative exports from Poland were equal to $ 342 billion).
Exports of commodity group 9403 amounted to 49% of total sales of group "" from Poland in 2023 (the value of exports of commodity group from Poland amounted to $11.8 billion in 2023). The share of exports of commodity group 9403 in sales of commodity group from Poland increased by 1.24 p.p. compared to 2022 (it was 48% in 2022, and exports of commodity group from Poland were $12 billion).
Where does Poland export Other furniture and parts thereof?
Top export destinations of "Other furniture and parts thereof" from Poland in 2023:
- Germany with a share of 35% (2.08 billion US$)
- France with a share of 7.43% (438 million US$)
- United Kingdom with a share of 5.82% (343 million US$)
- Czech Republic with a share of 4.73% (278 million US$)
- USA with a share of 4.68% (276 million US$)
- Netherlands with a share of 4.58% (270 million US$)
- Spain with a share of 3.14% (185 million US$)
- Italy with a share of 2.8% (165 million US$)
- Sweden with a share of 2.78% (164 million US$)
- Austria with a share of 2.68% (158 million US$)
Exports structure of 9403 - Other furniture and parts thereof - from Poland in 2023 represented by the following main commodity groups:
- 54% (3.21 billion US$): 940360 - Wooden furniture (excl. of 94.01 & 9403.30-9403.50)
- 19% (1.12 billion US$): 940350 - Wooden furniture of a kind used in the bedroom
- 10.2% (604 million US$): 940320 - Metal furniture (excl. of 94.01 & 94.02)
- 4.91% (289 million US$): 940330 - Wooden furniture of a kind used in offices
- 4.15% (244 million US$): 940340 - Wooden furniture of a kind used in the kitchen
- 1.96% (115 million US$): 940310 - Metal furniture of a kind used in offices
- 1.47% (87 million US$): 940370 - Furniture of plastics (excl. of 94.01)
The value of imports of commodity group 9403 "Other furniture and parts thereof" to Poland totalled $ 1.09 billion in 2023. Sales of commodity group 9403 to Poland decreased by 7.86% in value terms compared to 2022. imports of commodity group 9403 "Other furniture and parts thereof" decreased by $ 93 million (the value of imports of commodity group 9403 to Poland was equal to $1.19 billion in 2022)
Imports of commodity group 9403 "Other furniture and parts thereof" accounted for 0.321% of total import flow to Poland (in 2023, total imports to Poland amounted to $ 341 billion). The share of commodity group 9403 in total imports to Poland decreased by 0.01 p.p. compared to 2022 (it was 0.332% in 2022 and cumulative imports to Poland were equal to $ 358 billion).
Imports of commodity group 9403 reached 49% of total imports of group "" to Poland in 2023 (imports of commodity group to Poland totalled $2.21 billion in 2023). The share of purchases of commodity group 9403 in total imports of commodity group to Poland increased by 3.15 p.p. compared to 2022 (it was 46% in 2022, and imports of commodity group to Poland accounted for $2.56 billion).
Where does Poland import Other furniture and parts thereof from?
Top trading partners (import of "Other furniture and parts thereof") of Poland in 2023:
- China with a share of 35% (387 million US$)
- Germany with a share of 10.8% (119 million US$)
- Lithuania with a share of 8.71% (95 million US$)
- Ukraine with a share of 6.5% (71 million US$)
- Italy with a share of 6.22% (68 million US$)
- Spain with a share of 5.56% (61 million US$)
- Sweden with a share of 4.28% (47 million US$)
- Belarus with a share of 3.09% (34 million US$)
- Slovak Republic with a share of 2.52% (27 million US$)
- Czech Republic with a share of 1.96% (21 million US$)
Imports structure of 9403 - Other furniture and parts thereof - to Poland in 2023 represented by the following main commodity groups:
- 43% (482 million US$): 940320 - Metal furniture (excl. of 94.01 & 94.02)
- 31% (350 million US$): 940360 - Wooden furniture (excl. of 94.01 & 9403.30-9403.50)
- 7.87% (86 million US$): 940350 - Wooden furniture of a kind used in the bedroom
- 4.56% (50 million US$): 940340 - Wooden furniture of a kind used in the kitchen
- 3.75% (41 million US$): 940310 - Metal furniture of a kind used in offices
- 3.65% (40 million US$): 940370 - Furniture of plastics (excl. of 94.01)
- 2.3% (25 million US$): 940330 - Wooden furniture of a kind used in offices