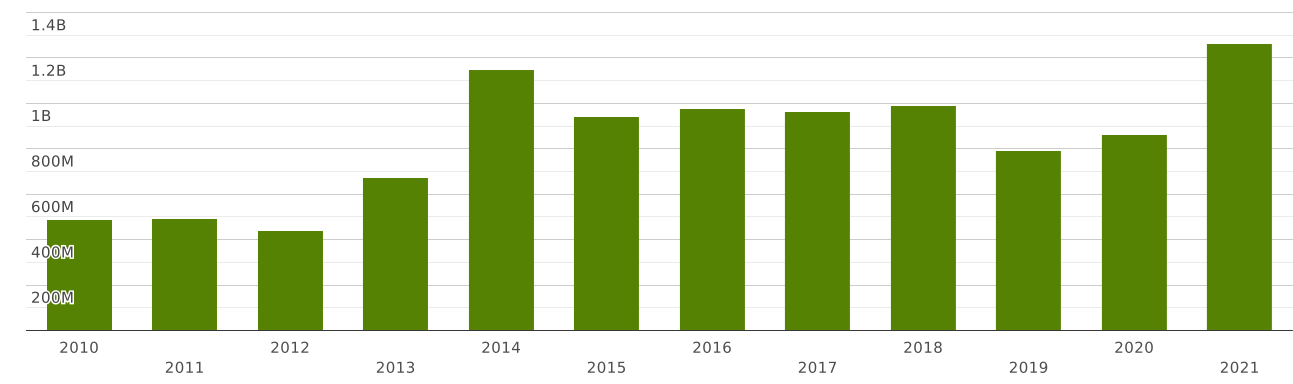
Russia | Imports and Exports | World | Soya beans (soybeans) | Value (US$) and Value Growth, YoY (%) | 2010 - 2021
The value of exports of commodity group 1201 "Soya beans, whether or not broken" from Russia totalled $ 408 million in 2021. Sales of commodity group 1201 from Russia decreased by 1.76% in value terms compared to 2020. exports of commodity group 1201 "Soya beans, whether or not broken" decreased by $ 7.32 million (cumulative exports of commodity group 1201 from Russia amounted $415 million in 2020)
Exports of commodity group 1201 "Soya beans, whether or not broken" amounted to 0.082% of total exports from Russia (cumulative merchandise exports from Russia totalled $ 492 billion in 2021). The share of commodity group 1201 in total exports from Russia decreased by 0.04 p.p. compared to 2020 (it was 0.123% in 2020 and cumulative exports from Russia were equal to $ 337 billion).
Exports of commodity group 1201 amounted to 32% of total sales of group "" from Russia in 2021 (the value of exports of commodity group from Russia amounted to $1.24 billion in 2021). The share of exports of commodity group 1201 in sales of commodity group from Russia increased by 7.47 p.p. compared to 2020 (it was 25% in 2020, and exports of commodity group from Russia were $1.63 billion).
Where does Russia export Soya beans, whether or not broken?
Top export destinations of "Soya beans, whether or not broken" from Russia in 2021:
- China with a share of 72% (297 million US$)
- Belarus with a share of 15.1% (61 million US$)
- Kazakhstan with a share of 7.18% (29 million US$)
- Korea with a share of 2.36% (9.66 million US$)
- Uzbekistan with a share of 1.56% (6.37 million US$)
- Turkey - 1.85 million US$
- Japan - 1.27 million US$
- Hong Kong - 373 thousand US$
- Lithuania - 61 thousand US$
- Mongolia - 36 thousand US$
Exports structure of 1201 - Soya beans, whether or not broken - from Russia in 2021 represented by the following main commodity groups:
The value of imports of commodity group 1201 "Soya beans, whether or not broken" to Russia totalled $ 1.26 billion in 2021. Sales of commodity group 1201 to Russia went up by 46% compared to 2020: imports of commodity group 1201 "Soya beans, whether or not broken" went up by $ 399 million (the value of imports of commodity group 1201 to Russia was equal to $862 million in 2020)
Imports of commodity group 1201 "Soya beans, whether or not broken" accounted for 0.429% of total import flow to Russia (in 2021, total imports to Russia amounted to $ 293 billion). The share of commodity group 1201 in total imports to Russia increased by 0.057 p.p. compared to 2020 (it was 0.372% in 2020 and cumulative imports to Russia were equal to $ 231 billion).
Imports of commodity group 1201 reached 53% of total imports of group "" to Russia in 2021 (imports of commodity group to Russia totalled $2.34 billion in 2021). The share of purchases of commodity group 1201 in total imports of commodity group to Russia increased by 7.71 p.p. compared to 2020 (it was 46% in 2020, and imports of commodity group to Russia accounted for $1.87 billion).
Where does Russia import Soya beans, whether or not broken from?
Top trading partners (import of "Soya beans, whether or not broken") of Russia in 2021:
- Brazil with a share of 44% (562 million US$)
- Paraguay with a share of 37% (477 million US$)
- Argentina with a share of 7.64% (96 million US$)
- Croatia with a share of 4.76% (60 million US$)
- Romania with a share of 2.24% (28 million US$)
- Serbia with a share of 1.71% (21 million US$)
- Uruguay - 7.19 million US$
- Korea - 2.33 million US$
- Canada - 2.25 million US$
- France - 1.59 million US$
Imports structure of 1201 - Soya beans, whether or not broken - to Russia in 2021 represented by the following main commodity groups: