Annual International Trade Statistics by Country (HS)
Publication date: 2024-01-28
Reporting period: 2002 - 2023
Timeseries: 194 million
Source:TrendEconomy
Time period
Commodity
Reporter
Trade flow
Partner
Indicator
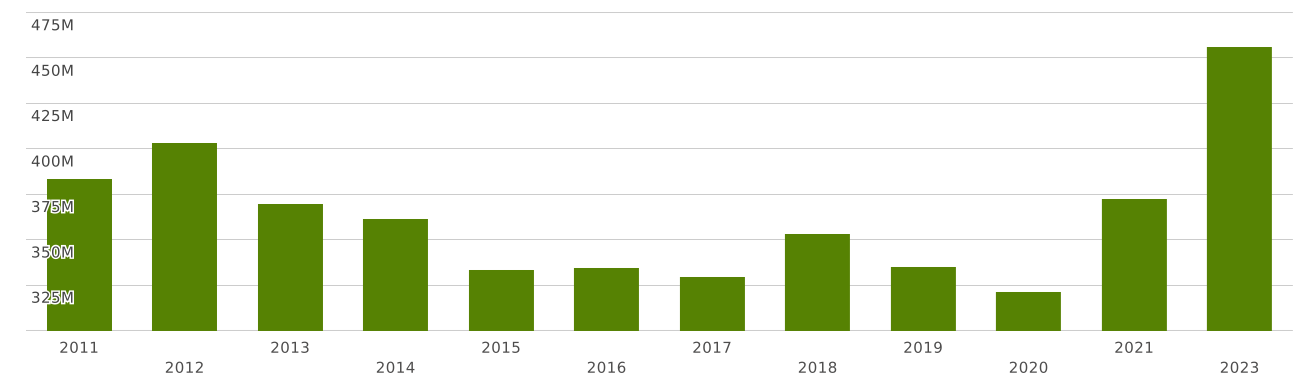
Saint Vincent and the Grenadines | Imports and Exports | World | ALL COMMODITIES | Value (US$) and Value Growth, YoY (%) | 2011 - 2023
Download chart
Download data
Fields
Rows
Columns
Group
Filter
Region
Values
X Axis
Dimensions
Y Axis
Y Axis Dimension
Left Y Axis
Right Y Axis
| Commodity | Reporter | Partner | Trade flow | Indicator | 2011 | 2012 | 2013 | 2014 | 2015 | 2016 | 2017 | 2018 | 2019 | 2020 | 2021 | 2023 |
| TOTAL. ALL COMMODITIES | Saint Vincent and the Grenadines | World | Exports | Value (US$) | 38,431,984.00 | 43,042,465.00 | 48,802,679.55 | 49,307,191.58 | 46,868,923.73 | 43,012,868.72 | 42,299,408.85 | 43,665,885.79 | 38,157,024.14 | 55,214,771.47 | 34,719,205.28 | 40,799,282.27 |
| Value Growth, YoY (%) | -7.42 | 11.99 | 13.38 | 1.03 | -4.94 | -8.22 | -1.65 | 3.23 | -12.61 | 44.70 | -37.11 | |||||
| Imports | Value (US$) | 383,476,910.00 | 403,242,335.00 | 369,910,153.78 | 361,551,896.63 | 333,671,111.32 | 334,767,433.14 | 329,952,436.68 | 353,627,074.29 | 335,230,895.64 | 321,193,214.61 | 372,496,089.10 | 456,433,084.89 | |||
| Value Growth, YoY (%) | 1.04 | 5.15 | -8.26 | -2.25 | -7.71 | 0.32 | -1.43 | 7.17 | -5.20 | -4.18 | 15.97 |
The value of merchandise exports from Saint Vincent and the Grenadines totalled $ 40 million in 2023. (the value of merchandise exports from Saint Vincent and the Grenadines amounted to $ in 2022)
Saint Vincent and the Grenadines's exports 2023 by country
Top export destinations of commodities from Saint Vincent and the Grenadines in 2023:
- Barbados with a share of 20% (8.5 million US$)
- Saint Lucia with a share of 15.1% (6.16 million US$)
- Saint Kitts and Nevis with a share of 13.3% (5.43 million US$)
- Dominica with a share of 11.6% (4.75 million US$)
- USA with a share of 11.2% (4.6 million US$)
- Antigua and Barbuda with a share of 9.12% (3.72 million US$)
- Trinidad and Tobago with a share of 5.78% (2.35 million US$)
- Grenada with a share of 4.84% (1.97 million US$)
- British Virgin Islands with a share of 1.35% (551 thousand US$)
- Belgium with a share of 1.28% (524 thousand US$)
Exports structure from Saint Vincent and the Grenadines in 2023 represented by the following main commodity groups:
- 26% (10.9 million US$): 11 - Products of the milling industry; malt; starches; inulin; wheat gluten
- 16.6% (6.8 million US$): 23 - Residues and waste from the food industries; prepared animal feed
- 10.9% (4.47 million US$): 03 - Fish and crustaceans, molluscs and other aquatic invertebrates
- 8.28% (3.37 million US$): 22 - Beverages, spirits and vinegar
- 6.67% (2.72 million US$): 84 - Nuclear reactors, boilers, machinery and mechanical appliances; parts thereof
- 3.63% (1.48 million US$): 76 - Aluminum and articles thereof
- 3.52% (1.43 million US$): 07 - Edible vegetables and certain roots and tubers
- 3.2% (1.3 million US$): 70 - Glass and glassware
- 2.8% (1.14 million US$): 72 - Iron and steel
- 2.23% (910 thousand US$): 08 - Edible fruit and nuts; peel of citrus fruit or melons
What did Saint Vincent and the Grenadines export in 2023?
Saint Vincent and the Grenadines's Top Exports in 2023:
- 26% ($10.9 million): 1101 - Wheat or meslin flour
- 16.5% ($6.76 million): 2309 - Preparations of a kind used in animal feeding.
- 4.65% ($1.89 million): 0307 - Molluscs; whether in shell or not, live, fresh, chilled, frozen, dried, salted or in brine; smoked molluscs, whether in shell or not, whether or not cooked before or during the smoking process
- 4.28% ($1.74 million): 0306 - Crustaceans; in shell or not, live, fresh, chilled, frozen, dried, salted or in brine; smoked, cooked or not before or during smoking; in shell, steamed or boiled, whether or not chilled, frozen, dried, salted or in brine
- 3.69% ($1.5 million): 8430 - Other moving, grading, levelling, scraping, excavating, tamping, compacting, extracting or boring machinery, for earth, minerals or ores; pile-drivers and pile-extractors; snow-ploughs and snow-blowers
- 3.65% ($1.48 million): 2202 - Waters, including mineral waters and aerated waters, containing added sugar or other sweetening matter or flavoured, and other non-alcoholic beverages, not including fruit or vegetable juices of heading 20.09.
- 3.57% ($1.46 million): 7610 - Aluminium structures (excluding prefabricated buildings of heading 94.06) and parts of structures (for example, bridges and bridge-sections, towers, lattice masts, roofs, roofing frameworks, doors and windows and their frames and thresholds for doors, balustrades, pillars and columns); aluminium plates, rods, profiles, tubes and the like, prepared for use in structures
- 3.54% ($1.44 million): 2203 - Beer made from malt
- 3.5% ($1.43 million): 0714 - Manioc, arrowroot, salep, Jerusalem artichokes, sweet potatoes and similar roots and tubers with high starch or inulin content, fresh, chilled, frozen or dried, whether or not sliced or in the form of pellets; sago pith.
- 3.19% ($1.3 million): 7010 - Carboys, bottles, flasks, jars, pots, phials, ampoules and other containers, of glass, of a kind used for the conveyance or packing of goods; preserving jars of glass; stoppers, lids and other closures, of glass
The value of merchandise imports to Saint Vincent and the Grenadines totalled $ 456 million in 2023. (the value of merchandise imports to Saint Vincent and the Grenadines was equal to $ in 2022)
Saint Vincent and the Grenadines's imports 2023 by country
Top trading partners (import sources) of Saint Vincent and the Grenadines in 2023:
- USA with a share of 44% (203 million US$)
- Trinidad and Tobago with a share of 8.8% (40 million US$)
- United Kingdom with a share of 7.51% (34 million US$)
- China with a share of 7.36% (33 million US$)
- Netherlands with a share of 2.92% (13.3 million US$)
- Japan with a share of 2.25% (10.2 million US$)
- Canada with a share of 1.53% (7 million US$)
- Barbados with a share of 1.49% (6.8 million US$)
- Turkey with a share of 1.45% (6.64 million US$)
- Germany with a share of 1.4% (6.4 million US$)
Imports structure to Saint Vincent and the Grenadines in 2023 represented by the following main commodity groups:
- 10.1% (46 million US$): 27 - Mineral fuels, mineral oils and products of their distillation; bituminous substances; mineral waxes
- 9.64% (44 million US$): 84 - Nuclear reactors, boilers, machinery and mechanical appliances; parts thereof
- 6.54% (29 million US$): 85 - Electrical machinery and equipment and parts thereof; sound recorders and reproducers, television image and sound recorders and reproducers, and parts and accessories of such articles
- 5.61% (25 million US$): 73 - Articles of iron or steel
- 5.39% (24 million US$): 87 - Vehicles other than railway or tramway rolling stock, and parts and accessories thereof
- 4.32% (19.7 million US$): 02 - Meat and edible meat offal
- 3.73% (17 million US$): 94 - Furniture; bedding, mattresses, mattress supports, cushions and similar stuffed furnishings; lamps and lighting fittings, n.e.s.; illuminated signs, illuminated name-plates and the like; prefabricated buildings
- 3.71% (16.9 million US$): 10 - Cereals
- 3.57% (16.3 million US$): 39 - Plastics and articles thereof
- 3.09% (14.1 million US$): 22 - Beverages, spirits and vinegar
What did Saint Vincent and the Grenadines import in 2023?
Saint Vincent and the Grenadines's Top Imports in 2023:
- 9.03% ($41 million): 2710 - Petroleum oils and oils from bituminous minerals, not crude; preparations n.e.c. containing by weight 70% or more of petroleum oils or oils from bituminous minerals; these being the basic constituents of the preparations; waste oils
- 3.4% ($15.5 million): 0207 - Meat and edible offal, of the poultry of heading 01.05, fresh, chilled or frozen.
- 2.34% ($10.7 million): 1001 - Wheat and meslin.
- 2.3% ($10.5 million): 8703 - Motor cars and other motor vehicles principally designed for the transport of persons (other than those of heading 87.02), including station wagons and racing cars
- 1.79% ($8.21 million): 2523 - Portland cement, aluminous cement, slag cement, supersulphate cement and similar hydraulic cements, whether or not coloured or in the form of clinkers
- 1.74% ($7.96 million): 2106 - Food preparations not elsewhere specified or included
- 1.73% ($7.92 million): 9403 - Other furniture and parts thereof
- 1.56% ($7.13 million): 7306 - Other tubes, pipes and hollow profiles (for example, open seam or welded, riveted or similarly closed), of iron or steel
- 1.34% ($6.13 million): 8517 - Electrical apparatus for line telephony or line telegraphy, including line telephone sets with cordless handsets and telecommunication apparatus for carrier-current line systems or for digital line systems; videophones
- 1.32% ($6.02 million): 7308 - Structures (excluding prefabricated buildings of heading 94.06) and parts of structures (for example, bridges and bridge-sections, lock-gates, towers, lattice masts, roofs, roofing frame-works, doors and windows and their frames and thresholds for doors, shutters, balustrades, pillars and columns), of iron or steel; plates, rods, angles, shapes, sections, tubes and the like, prepared for use in structures, of iron or steel
Download chart
Download data
Fields
Rows
Columns
Group
Filter
Region
Values
X Axis
Dimensions
Y Axis
Y Axis Dimension
Left Y Axis
Right Y Axis