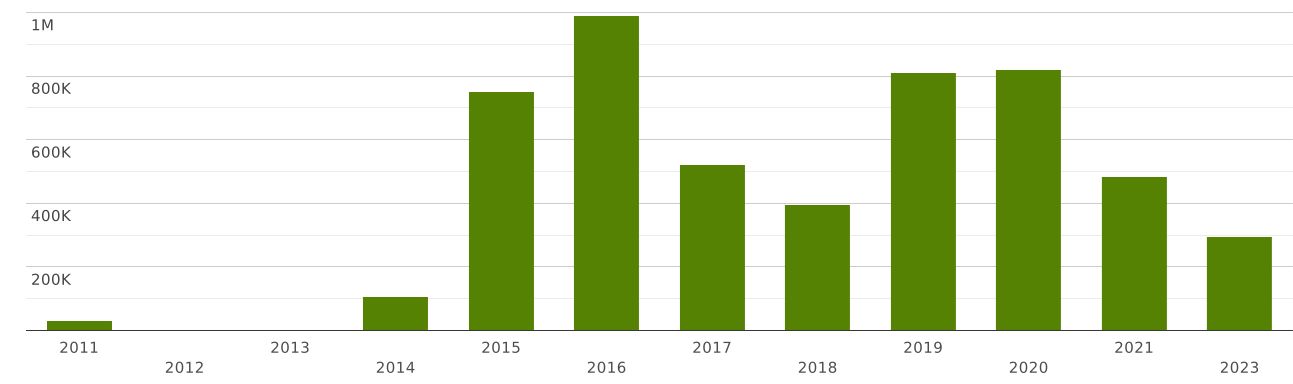
Saudi Arabia | Imports and Exports | World | Copper ores and concentrates | Value (US$) and Value Growth, YoY (%) | 2011 - 2023
The value of exports of commodity group 2603 "Copper ores and concentrates" from Saudi Arabia totalled $ 590 million in 2023. (cumulative exports of commodity group 2603 from Saudi Arabia amounted $ in 2022)
Exports of commodity group 2603 "Copper ores and concentrates" amounted to 0.184% of total exports from Saudi Arabia (cumulative merchandise exports from Saudi Arabia totalled $ 320 billion in 2023).
Exports of commodity group 2603 amounted to 91% of total sales of group "" from Saudi Arabia in 2023 (the value of exports of commodity group from Saudi Arabia amounted to $647 million in 2023).
Where does Saudi Arabia export Copper ores and concentrates?
Top export destinations of "Copper ores and concentrates" from Saudi Arabia in 2023:
- China with a share of 84% (497 million US$)
- Japan with a share of 10.1% (60 million US$)
- Malaysia with a share of 4.7% (27 million US$)
- Mexico - 5.31 million US$
Exports structure of 2603 - Copper ores and concentrates - from Saudi Arabia in 2023 represented by the following main commodity groups:
- 100% (590 million US$): 260300 - Copper ores & concentrates
The value of imports of commodity group 2603 "Copper ores and concentrates" to Saudi Arabia totalled $ 296 thousand in 2023. (the value of imports of commodity group 2603 to Saudi Arabia was equal to $ in 2022)
Imports of commodity group 2603 reached 0.041% of total imports of group "" to Saudi Arabia in 2023 (imports of commodity group to Saudi Arabia totalled $708 million in 2023).
Where does Saudi Arabia import Copper ores and concentrates from?
Top trading partners (import of "Copper ores and concentrates") of Saudi Arabia in 2023:
- Japan with a share of 97% (288 thousand US$)
- United Kingdom with a share of 2.64% (7.85 thousand US$)
Imports structure of 2603 - Copper ores and concentrates - to Saudi Arabia in 2023 represented by the following main commodity groups:
- 100% (296 thousand US$): 260300 - Copper ores & concentrates