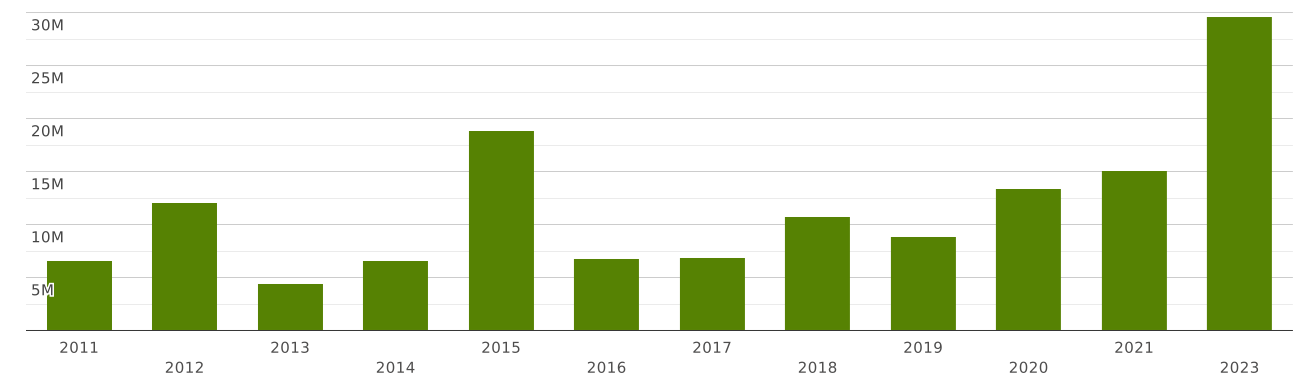
Saudi Arabia | Imports and Exports | World | Silicates; commercial alkali metal silicates | Value (US$) and Value Growth, YoY (%) | 2011 - 2023
| Commodity | Reporter | Partner | Trade flow | Indicator | 2011 | 2012 | 2013 | 2014 | 2015 | 2016 | 2017 | 2018 | 2019 | 2020 | 2021 | 2023 |
| 2839. Silicates; commercial alkali metal silicates | Saudi Arabia | World | Exports | Value (US$) | 9,700,279.00 | 13,216,283.00 | 12,250,949.00 | 14,568,305.00 | 9,890,210.96 | 6,646,132.35 | 7,648,555.68 | 10,043,345.25 | 8,858,243.19 | 9,106,282.69 | 6,775,741.69 | 8,792,053.11 |
| Value Growth, YoY (%) | 15.12 | 36.24 | -7.30 | 18.91 | -32.11 | -32.80 | 15.08 | 31.31 | -11.79 | 2.80 | -25.59 | |||||
| Imports | Value (US$) | 6,597,608.00 | 12,036,015.00 | 4,396,539.00 | 6,630,234.00 | 18,861,537.28 | 6,791,208.48 | 6,904,615.24 | 10,732,508.80 | 8,837,694.11 | 13,360,347.65 | 15,101,328.68 | 29,595,911.79 | |||
| Value Growth, YoY (%) | 6.37 | 82.42 | -63.47 | 50.80 | 184.47 | -63.99 | 1.66 | 55.43 | -17.65 | 51.17 | 13.03 |
The value of exports of commodity group 2839 "Silicates; commercial alkali metal silicates" from Saudi Arabia totalled $ 8.79 million in 2023. (cumulative exports of commodity group 2839 from Saudi Arabia amounted $ in 2022)
Exports of commodity group 2839 "Silicates; commercial alkali metal silicates" amounted to 0.002% of total exports from Saudi Arabia (cumulative merchandise exports from Saudi Arabia totalled $ 320 billion in 2023).
Exports of commodity group 2839 amounted to 0.435% of total sales of group "" from Saudi Arabia in 2023 (the value of exports of commodity group from Saudi Arabia amounted to $2.01 billion in 2023).
Where does Saudi Arabia export Silicates; commercial alkali metal silicates?
Top export destinations of "Silicates; commercial alkali metal silicates" from Saudi Arabia in 2023:
- Jordan with a share of 30% (2.69 million US$)
- United Arab Emirates with a share of 30% (2.68 million US$)
- Qatar with a share of 8.89% (782 thousand US$)
- Oman with a share of 7.04% (619 thousand US$)
- Bahrain with a share of 4.74% (417 thousand US$)
- Sudan with a share of 4.39% (386 thousand US$)
- Yemen with a share of 4.23% (372 thousand US$)
- Algeria with a share of 3.36% (295 thousand US$)
- Somalia with a share of 3.12% (274 thousand US$)
- Turkey with a share of 1% (88 thousand US$)
Exports structure of 2839 - Silicates; commercial alkali metal silicates - from Saudi Arabia in 2023 represented by the following main commodity groups:
- 99% (8.77 million US$): 283919 - Silicates of sodium other than sodiummetasilicates
- 0.206% (18.1 thousand US$): 283911 - Sodium metasilicates
The value of imports of commodity group 2839 "Silicates; commercial alkali metal silicates" to Saudi Arabia totalled $ 29 million in 2023. (the value of imports of commodity group 2839 to Saudi Arabia was equal to $ in 2022)
Imports of commodity group 2839 "Silicates; commercial alkali metal silicates" accounted for 0.014% of total import flow to Saudi Arabia (in 2023, total imports to Saudi Arabia amounted to $ 206 billion).
Imports of commodity group 2839 reached 2.16% of total imports of group "" to Saudi Arabia in 2023 (imports of commodity group to Saudi Arabia totalled $1.36 billion in 2023).
Where does Saudi Arabia import Silicates; commercial alkali metal silicates from?
Top trading partners (import of "Silicates; commercial alkali metal silicates") of Saudi Arabia in 2023:
- China with a share of 77% (23 million US$)
- USA with a share of 8.55% (2.53 million US$)
- India with a share of 2.34% (694 thousand US$)
- Italy with a share of 2.31% (685 thousand US$)
- Malaysia with a share of 2.05% (607 thousand US$)
- Germany with a share of 1.87% (555 thousand US$)
- United Arab Emirates with a share of 1.25% (371 thousand US$)
- Pakistan - 236 thousand US$
- Spain - 202 thousand US$
- Slovenia - 182 thousand US$
Imports structure of 2839 - Silicates; commercial alkali metal silicates - to Saudi Arabia in 2023 represented by the following main commodity groups:
- 84% (25 million US$): 283990 - Silicates; commercial alkali metal silicates, other than of sodium
- 14.6% (4.32 million US$): 283919 - Silicates of sodium other than sodiummetasilicates
- 0.889% (263 thousand US$): 283911 - Sodium metasilicates