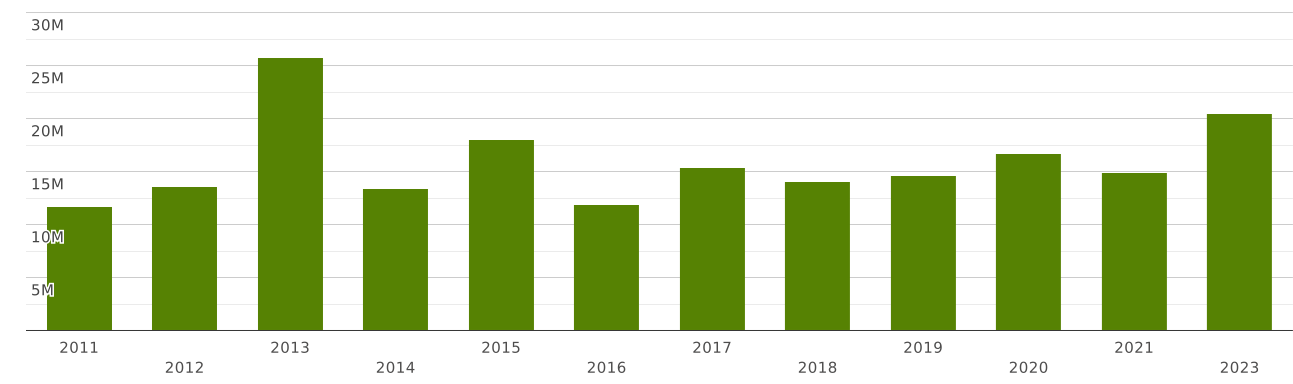
Saudi Arabia | Imports and Exports | World | Activated carbon; activated natural mineral products | Value (US$) and Value Growth, YoY (%) | 2011 - 2023
| Commodity | Reporter | Partner | Trade flow | Indicator | 2011 | 2012 | 2013 | 2014 | 2015 | 2016 | 2017 | 2018 | 2019 | 2020 | 2021 | 2023 |
| 3802. Activated carbon; activated natural mineral products; animal black, including spent animal black | Saudi Arabia | World | Exports | Value (US$) | 27,467.00 | 142,400.00 | 155,816.00 | 58,090.68 | 43,013.60 | 375,771.10 | 31,928.79 | 206,898.12 | ||||
| Value Growth, YoY (%) | 418.44 | 9.42 | -25.95 | -91.50 | ||||||||||||
| Imports | Value (US$) | 11,702,148.00 | 13,581,350.00 | 25,773,899.00 | 13,350,638.00 | 17,999,240.37 | 11,842,681.47 | 15,360,200.44 | 14,010,831.88 | 14,584,219.04 | 16,693,919.35 | 14,904,784.69 | 20,467,139.48 | |||
| Value Growth, YoY (%) | 15.02 | 16.05 | 89.77 | -48.20 | 34.81 | -34.20 | 29.70 | -8.78 | 4.09 | 14.46 | -10.71 |
The value of exports of commodity group 3802 "Activated carbon; activated natural mineral products; animal black, including spent animal black" from Saudi Arabia totalled $ 206 thousand in 2023. (cumulative exports of commodity group 3802 from Saudi Arabia amounted $ in 2022)
Exports of commodity group 3802 amounted to 0.017% of total sales of group "" from Saudi Arabia in 2023 (the value of exports of commodity group from Saudi Arabia amounted to $1.18 billion in 2023).
Where does Saudi Arabia export Activated carbon; activated natural mineral products; animal black, including spent animal black?
Top export destinations of "Activated carbon; activated natural mineral products; animal black, including spent animal black" from Saudi Arabia in 2023:
- United Arab Emirates with a share of 87% (180 thousand US$)
- Bahrain with a share of 11.1% (23 thousand US$)
- Oman with a share of 1.1% (2.29 thousand US$)
- Kuwait - 713 US$
Exports structure of 3802 - Activated carbon; activated natural mineral products; animal black, including spent animal black - from Saudi Arabia in 2023 represented by the following main commodity groups:
- 97% (201 thousand US$): 380290 - Activated nat. min. products other than of activated carbon; animal black, incl. spent animal black
- 2.83% (5.86 thousand US$): 380210 - Activated carbon
The value of imports of commodity group 3802 "Activated carbon; activated natural mineral products; animal black, including spent animal black" to Saudi Arabia totalled $ 20 million in 2023. (the value of imports of commodity group 3802 to Saudi Arabia was equal to $ in 2022)
Imports of commodity group 3802 "Activated carbon; activated natural mineral products; animal black, including spent animal black" accounted for 0.009% of total import flow to Saudi Arabia (in 2023, total imports to Saudi Arabia amounted to $ 206 billion).
Imports of commodity group 3802 reached 0.754% of total imports of group "" to Saudi Arabia in 2023 (imports of commodity group to Saudi Arabia totalled $2.71 billion in 2023).
Where does Saudi Arabia import Activated carbon; activated natural mineral products; animal black, including spent animal black from?
Top trading partners (import of "Activated carbon; activated natural mineral products; animal black, including spent animal black") of Saudi Arabia in 2023:
- India with a share of 28% (5.8 million US$)
- China with a share of 18.9% (3.87 million US$)
- USA with a share of 13.9% (2.85 million US$)
- Italy with a share of 11.6% (2.38 million US$)
- Germany with a share of 6.85% (1.4 million US$)
- Sri Lanka with a share of 6.4% (1.31 million US$)
- Netherlands with a share of 5.57% (1.14 million US$)
- Spain with a share of 2.84% (582 thousand US$)
- Turkey with a share of 1.21% (249 thousand US$)
- United Kingdom with a share of 1.09% (224 thousand US$)
Imports structure of 3802 - Activated carbon; activated natural mineral products; animal black, including spent animal black - to Saudi Arabia in 2023 represented by the following main commodity groups:
- 81% (16.6 million US$): 380210 - Activated carbon
- 18.4% (3.77 million US$): 380290 - Activated nat. min. products other than of activated carbon; animal black, incl. spent animal black